

On Monday, July 6, Iranian military forces launched at least two missiles at commercial vessels passing through the Strait of Hormuz, Axios reported, citing US officials. The attack came after the expiration of a one-week agreement between the United States and Iran to suspend strikes in the strait. In response, the US military is considering the possibility of strikes against Iranian facilities. Washington also believes that Iran may be laying the groundwork for introducing a future transit-fee system for ships passing through the strait. The incident occurred amid ongoing mourning events in Iran related to the funeral of former Supreme Leader Ayatollah Ali Khamenei, which have been accompanied by calls for retaliation against the United States and Israel. US President Donald Trump said on Monday that Washington would either reach a deal with Iran or “finish the job,” reviving the threat of military action. At the same time, a round of indirect talks between the United States and Iran in Doha last week ended without significant progress.
Meanwhile, oil prices were supported by the outcome of the latest meeting of the OPEC+ oil-producing alliance. Seven cartel members, including Kazakhstan, Saudi Arabia, Russia, Iraq, Kuwait, Algeria and Oman, decided at their meeting on Sunday, July 5, to raise the August production target by 188 thousand barrels per day. This marks the fourth consecutive monthly increase in quotas, while the countries also reaffirmed their intention to fully compensate for all overproduction volumes accumulated since January 2024. At the same time, Saudi Arabia announced a sharp reduction in the official selling price for its flagship Arab Light grade for Asian buyers, cutting it by $11 per barrel to $1.50 below the Oman/Dubai average price, the largest reduction in more than two decades. The United Arab Emirates increased production in June to more than 3.8 million barrels per day, the highest level since April 2020 and above pre-conflict levels, following its exit from OPEC+ quotas. Analysts warn that these moves may signal the beginning of a price war among Gulf producers.
Investors also remain focused on macroeconomic data released last week. According to the US Energy Information Administration (EIA), commercial crude oil inventories in the United States declined by 3.775 million barrels to their lowest level since September 2018. However, this positive signal was fully offset by geopolitical and macroeconomic factors. Analysts had expected an even larger decline of 5.1 million barrels.
Forecasts from major investment banks reflect the continuing bearish outlook for oil. Citigroup expects Brent to fall to $60–65 per barrel by the end of the year as flows through the Strait of Hormuz normalise and supply risks ease. Goldman Sachs lowered its average Brent price forecast for the fourth quarter of 2026 to $80 per barrel from the previous estimate of $90. A Chinese brokerage firm expects Brent to trade in the $65–80 per barrel range in July.
Support and resistance levels
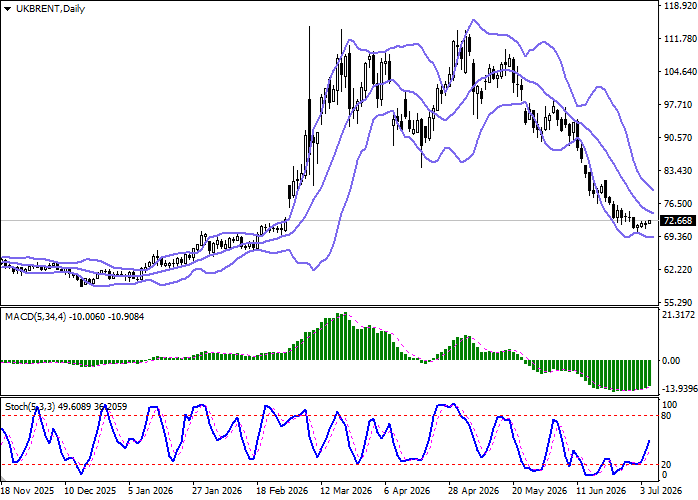
On the daily chart, the Bollinger Bands indicator is turning sideways. The price range is narrowing quickly, reflecting mixed trading conditions in the very short term.
The MACD indicator is rising, maintaining a relatively strong buy signal, with the histogram positioned above the signal line.
The Stochastic oscillator is showing more confident growth and is currently located near the middle of its working range, indicating sufficient room for the development of a corrective upward trend in the near-term timeframes.
Resistance levels: 74.00, 77.00, 80.00, 82.64.
Support levels: 72.00, 70.00, 68.00, 66.00.
UK BRENT Oil Trading Scenarios and Price Forecast
Long positions may be opened after a confident upside breakout above 74.00, with a target at 80.00. Stop-loss: 71.00. Expected implementation period: 2–3 days.
A rebound from 74.00 as resistance followed by a break below 72.00 may signal opportunities to open new short positions with a target at 68.00. Stop-loss: 74.00.
Scenario
| Timeframe | Intraday |
| Recommendation | BUY STOP |
| Entry point | 74.05 |
| Take Profit | 80.00 |
| Stop Loss | 71.00 |
| Key levels | 66.00, 68.00, 70.00, 72.00, 74.00, 77.00, 80.00, 82.64 |
Alternative Scenario
| Recommendation | SELL STOP |
| Entry point | 71.95 |
| Take Profit | 68.00 |
| Stop Loss | 74.00 |
| Key levels | 66.00, 68.00, 70.00, 72.00, 74.00, 77.00, 80.00, 82.64 |
