
Speaking before the House of Lords Economic Affairs Committee, the Governor of the Bank of England said that returning inflation to the 2.0% target is a necessary condition for restoring household confidence in the central bank’s authority. At the same time, he firmly rejected the idea of raising the target to 3.0% as a way to address recent deviations. The official noted that in April he voted with the majority of his colleagues, 8–1, to keep the interest rate at 3.75%, adding that this borrowing cost gives the regulator more time to assess whether monetary policy needs to be tightened in response to inflationary pressure caused by the blockade of the Strait of Hormuz. Forecasts suggest that the rate may rise by around 32 basis points this year.
Meanwhile, the U.S. dollar continues to receive support from May business activity data from the Institute for Supply Management: the manufacturing index rose from 52.7 points to 54.0 points, exceeding expectations of 53.0 points. In addition, the number of job openings increased in April from 6.89 million to 7.62 million, the highest level since May 2024 and well above forecasts of 6.88 million, while the vacancy rate rose from 4.2% to 4.6%. However, the number of hires fell by 419.0K to 5.116 million: companies prefer to retain existing staff but are not rushing to expand their workforce, which is also confirmed by a decline in layoffs. At the same time, the number of people voluntarily leaving their jobs fell from 2.5% to 2.0%, the lowest level since August 2020, which is usually interpreted as weaker confidence in labor market stability. It is worth noting that the bullish effect for the U.S. currency was limited, and closer to the end of the daily session, the dollar gave back part of its gains.
Meanwhile, the corporate sector remains resilient even amid rising geopolitical tensions and higher commodity costs. According to estimates by The Goldman Sachs Group Inc., companies in the S&P 500 index excluding the energy sector recorded a 6.3% year-on-year increase in real revenue in the first quarter, indicating continued strong business activity and stable domestic demand. Analysts note only limited signs of a slowdown in consumer spending despite the U.S.–Iran confrontation and the related rise in hydrocarbon prices. However, in the second half of the year, the indicator may decline to 1.3% amid low personal savings and a 1.1% year-on-year drop in disposable household income in April. The escalation of the Middle East conflict is increasing pressure on corporate costs and business margins.
The price announcement indicator, which reflects the dynamics of purchase and selling prices, rose to its highest level since the end of 2023. In addition to higher energy costs, businesses cite rising prices for maritime transportation, resin-based materials, computer memory, and other technology components. Despite the worsening price environment, investment activity in the sector remains high thanks to the large-scale development of artificial intelligence technologies. During the corporate earnings season, technology giants raised their 2026 capital expenditure plans by 12.0%, bringing the combined total to 750.0 billion dollars. According to The Goldman Sachs Group Inc., corporate fixed investment will increase by almost 8.0% this year, with about three percentage points coming from spending on AI projects and another three from tax incentives included in last year’s budget, allowing the sector to remain one of the key drivers of the national economy.
Support and resistance levels
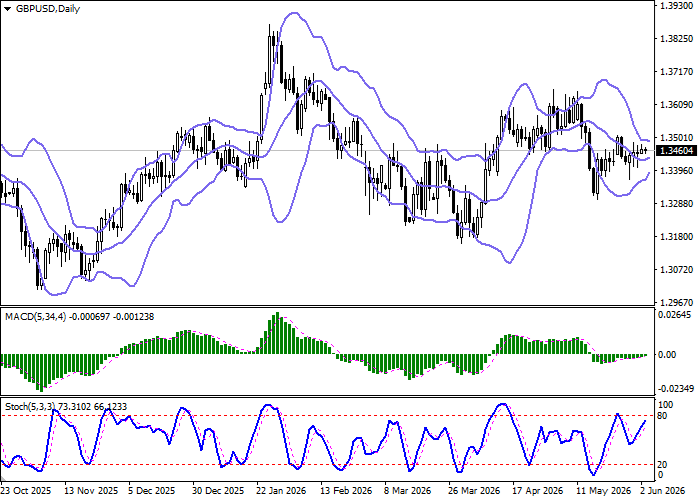
On the daily chart, Bollinger Bands are turning upward: the price range is narrowing, limiting the potential for a positive trend in the nearest timeframes. The MACD indicator is rising, maintaining a buy signal as the histogram remains above the signal line, and is trying to consolidate above the zero line. Stochastic is located near the “80” mark, indicating overbought risks for the asset in the ultra-short term.
Resistance levels: 1.3500, 1.3550, 1.3600, 1.3650.
Support levels: 1.3447, 1.3402, 1.3350, 1.3300.
GBP/USD trading scenarios and forecast
Long positions may be opened after a breakout above 1.3500, with a target at 1.3600. Stop-loss — 1.3447. Expected timeframe: 2–3 days.
Short positions may be opened after a breakout below 1.3402, with a target at 1.3300. Stop-loss — 1.3447.
Scenario
| Timeframe | Intraday |
| Recommendation | BUY STOP |
| Entry point | 1.3505 |
| Take Profit | 1.3600 |
| Stop Loss | 1.3447 |
| Key levels | 1.3300, 1.3350, 1.3402, 1.3447, 1.3500, 1.3550, 1.3600, 1.3650 |
Alternative scenario
| Recommendation | SELL STOP |
| Entry point | 1.3400 |
| Take Profit | 1.3300 |
| Stop Loss | 1.3447 |
| Key levels | 1.3300, 1.3350, 1.3402, 1.3447, 1.3500, 1.3550, 1.3600, 1.3650 |
