
Investors are monitoring developments in the Persian Gulf region. This week, the United States and Iran exchanged a series of attacks on military facilities, sharply increasing tensions. However, diplomatic contacts between the parties continued despite official Tehran’s statements about withdrawing from the process. U.S. President Donald Trump said that the Islamic Republic is ready to abandon its nuclear program and that a deal could be concluded as early as this weekend. As a result, the dollar, as a traditional safe-haven asset, lost some ground. Nevertheless, investors prefer to remain cautious, as promises of a quick resolution to the crisis have been coming for more than a month.
Meanwhile, experts have revised their forecasts for the tightening of the Bank of England’s monetary policy. Previously, most analysts expected two interest rate hikes before the end of the year, but after the publication of inflation statistics, they now expect only one adjustment. In April, the consumer price index came in at 2.8% instead of the preliminary estimate of 3.0%, while British business expectations for the next 12 months, according to the regulator’s May survey, declined from 4.4% to 4.0%, as the initial energy shock linked to the Middle East conflict is weakening.
Traders’ confidence in the hawkish stance of the U.S. Federal Reserve is strengthening, but the timing and scale of possible rate hikes remain unknown. Much will depend on today’s publication of May labor market statistics at 14:30 (GMT+2). Nonfarm payrolls are expected to reach 85.0K, while unemployment is projected to remain at 4.3%. If these forecasts are confirmed, higher borrowing costs in the medium term will become a very likely scenario. However, if the sector shows signs of cooling, officials may consider keeping current monetary policy unchanged.
Support and resistance levels
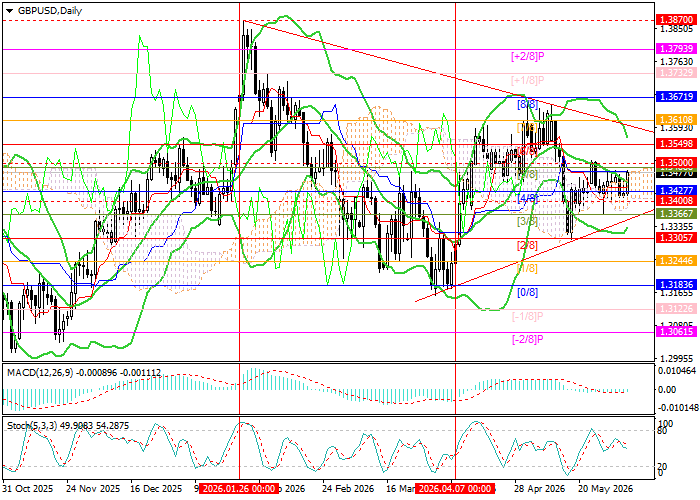
The trading instrument is moving within the main sideways range of 1.3500–1.3400 and may exit it either upward or downward. After overcoming the 1.3500 mark, further growth toward 1.3610, the Murray level [7/8], and 1.3671, the Murray level [8/8], is expected. However, if the 1.3400 level is broken, the asset may exit the descending triangle pattern and reach the areas of 1.3305, the Murray level [2/8], and 1.3183, the Murray level [0/8].
Technical indicators maintain a sell signal: Bollinger Bands and Stochastic are turning downward, while the MACD histogram holds small volumes in the negative zone.
Resistance levels: 1.3500, 1.3610, 1.3671.
Support levels: 1.3400, 1.3305, 1.3183.
GBP/USD trading scenarios and forecast
Short positions may be opened below 1.3400, with targets at 1.3305 and 1.3183 and a stop-loss at 1.3470. Expected timeframe: 5–7 days. Long positions may be opened above 1.3500, with targets at 1.3610 and 1.3671 and a stop-loss at 1.3440.
Scenario
| Timeframe | Weekly |
| Recommendation | SELL STOP |
| Entry point | 1.3395 |
| Take Profit | 1.3305, 1.3183 |
| Stop Loss | 1.3470 |
| Key levels | 1.3183, 1.3305, 1.3400, 1.3500, 1.3610, 1.3671 |
Alternative scenario
| Recommendation | BUY STOP |
| Entry point | 1.3505 |
| Take Profit | 1.3610, 1.3671 |
| Stop Loss | 1.3440 |
| Key levels | 1.3183, 1.3305, 1.3400, 1.3500, 1.3610, 1.3671 |
