

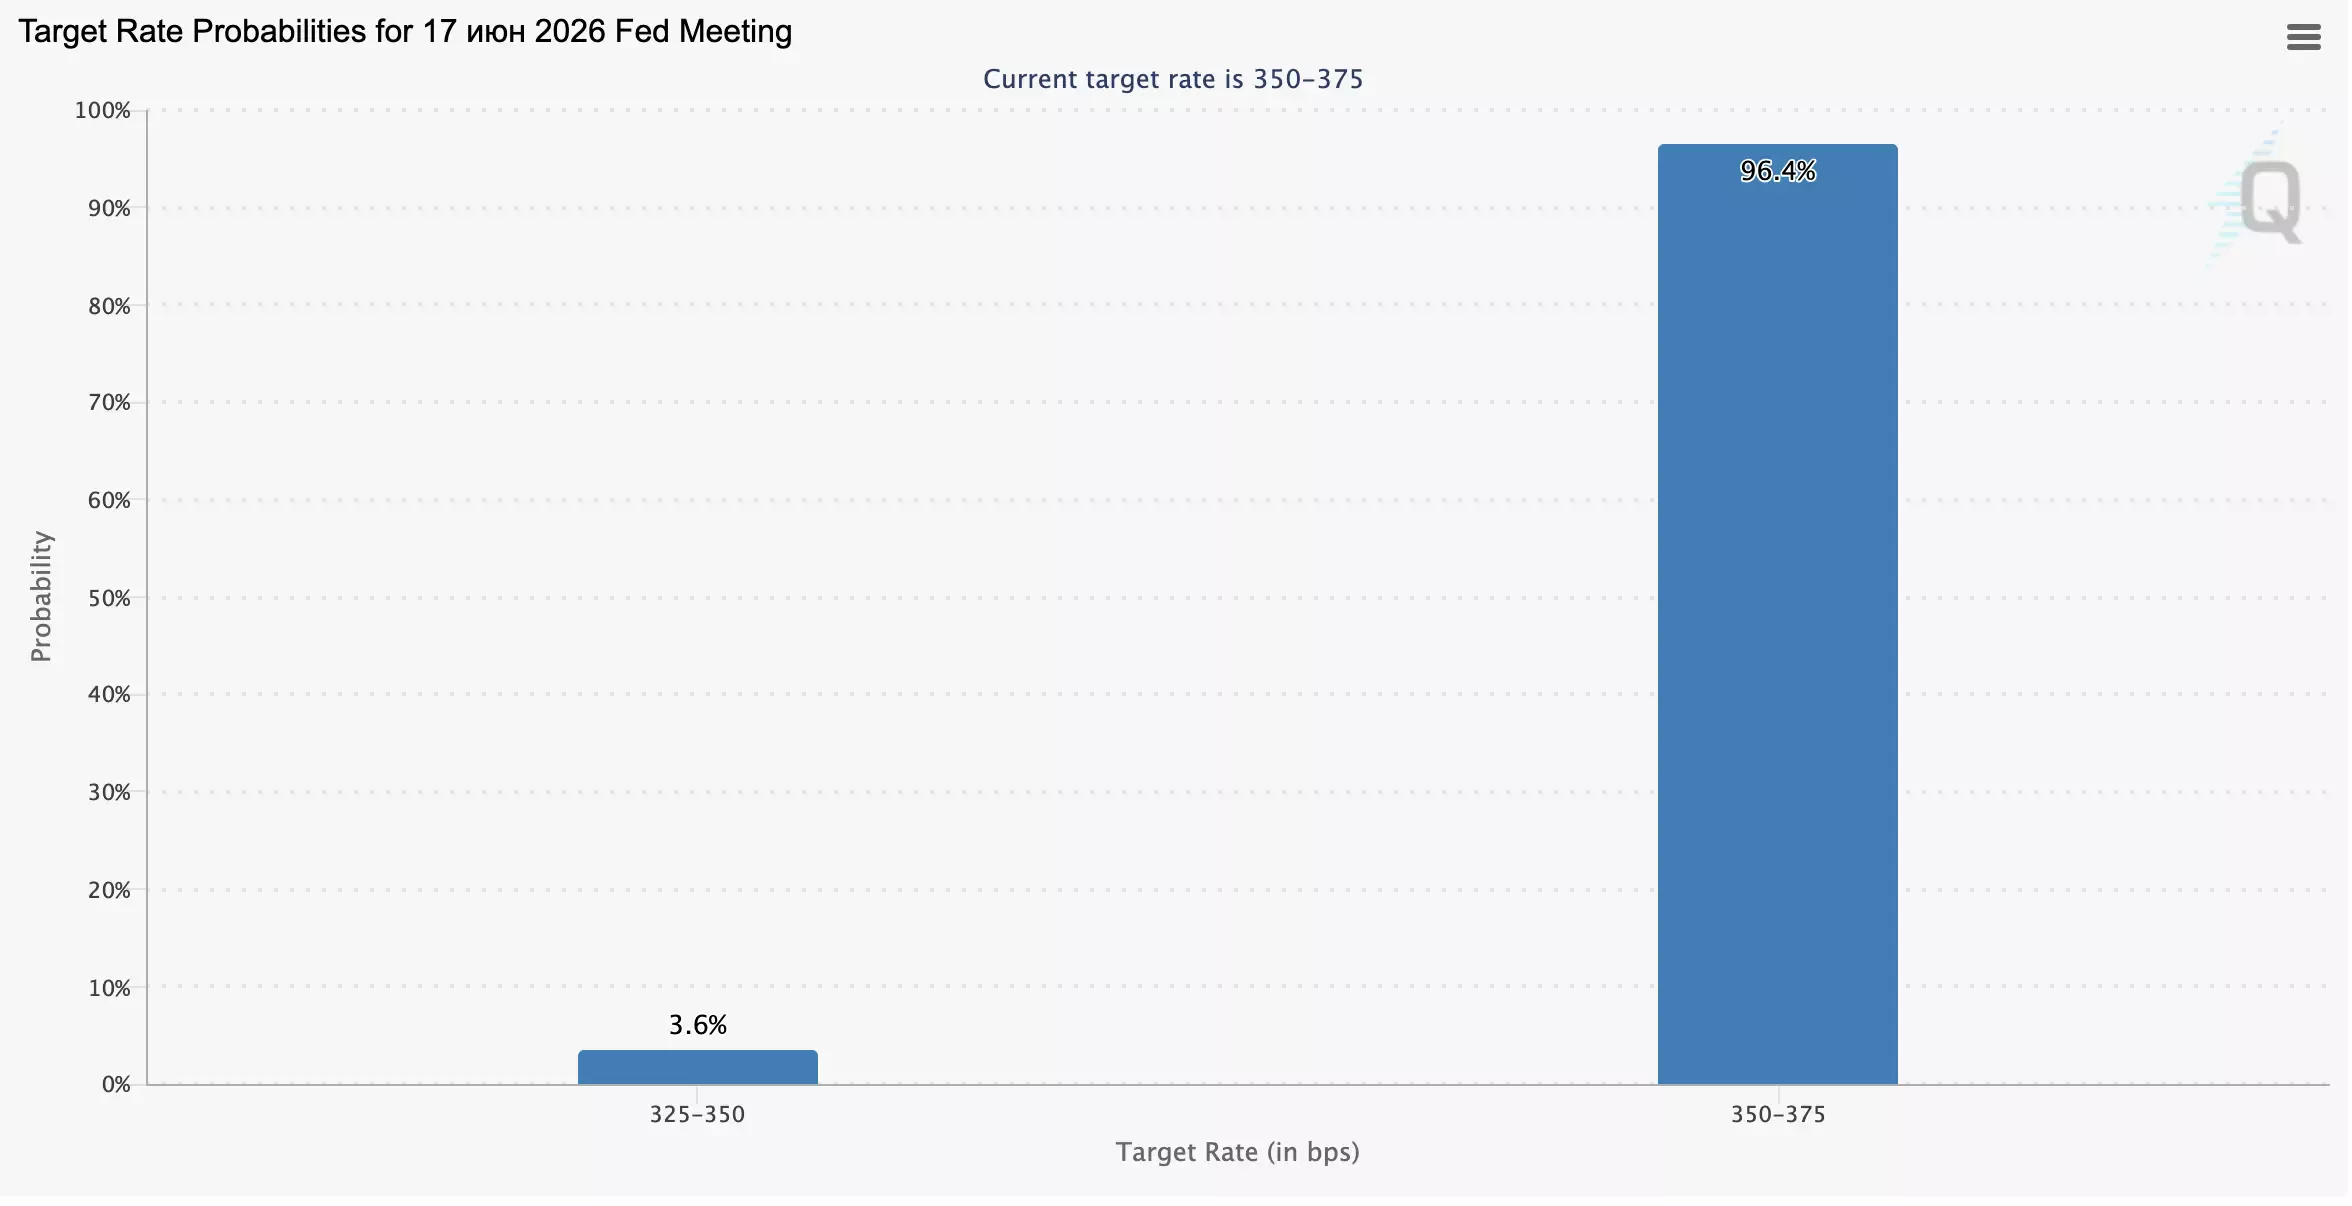
Analysts expect nonfarm payrolls to slow from 115.0K to 85.0K, while the unemployment rate is projected to remain at 4.3%. Similar data from Automatic Data Processing showed an increase to a 16-month high of 122.0K, although a slight acceleration in initial jobless claims and the general slowdown in economic momentum point to the possibility of weaker figures. Any signs of continued labor market resilience would strengthen hawkish expectations regarding the U.S. Federal Reserve: according to the CME FedWatch Tool, traders estimate the probability of at least one interest rate increase this year at 48.0%.
Experts are assessing Swiss inflation statistics published the day before: in May, the consumer price index remained at 0.6% year-on-year, while analysts had expected 0.8%, and rose by 0.2% month-on-month, below the forecast of 0.3%, amid higher rents and hotel services. At the same time, pressure from rising hydrocarbon prices caused by the closure of the Strait of Hormuz proved much less pronounced than in other countries. Thus, the national economy remains isolated from the global crisis thanks to the strengthening of the franc, which offsets the rise in prices for imported goods, including energy resources.
According to the Swiss National Bank’s forecast published in March, if the key rate remains at 0.00%, average annual inflation will be 0.5% in 2026 and 2027, and 0.6% in 2028. Throughout the entire forecast period, the consumer price index remains within the range compatible with price stability. The low May figures only confirm these estimates and leave the regulator with no grounds for tightening monetary policy.
Support and resistance levels
On the daily chart, Bollinger Bands are turning horizontal: the price range is almost unchanged, remaining wide enough for the current level of market activity. The MACD indicator is rising, maintaining a buy signal as the histogram remains above the signal line, while Stochastic, having approached the “80” mark, is trying to turn downward, indicating the likelihood of a downward correction in the nearest timeframes.
Resistance levels: 0.7906, 0.7926, 0.7957, 0.7990.
Support levels: 0.7878, 0.7845, 0.7822, 0.7807.
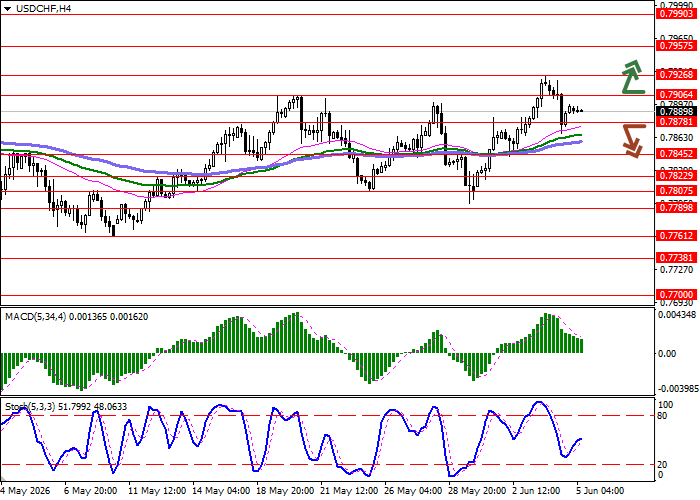
USD/CHF trading scenarios and forecast
Short positions may be opened after a breakout below 0.7878, with a target at 0.7822. Stop-loss — 0.7906. Expected timeframe: 2–3 days.
Long positions may be opened after a breakout above 0.7906, with a target at 0.7957. Stop-loss — 0.7878.
Scenario
| Timeframe | Intraday |
| Recommendation | SELL STOP |
| Entry point | 0.7875 |
| Take Profit | 0.7822 |
| Stop Loss | 0.7906 |
| Key levels | 0.7807, 0.7822, 0.7845, 0.7878, 0.7906, 0.7926, 0.7957, 0.7990 |
Alternative scenario
| Recommendation | BUY STOP |
| Entry point | 0.7910 |
| Take Profit | 0.7957 |
| Stop Loss | 0.7878 |
| Key levels | 0.7807, 0.7822, 0.7845, 0.7878, 0.7906, 0.7926, 0.7957, 0.7990 |
