
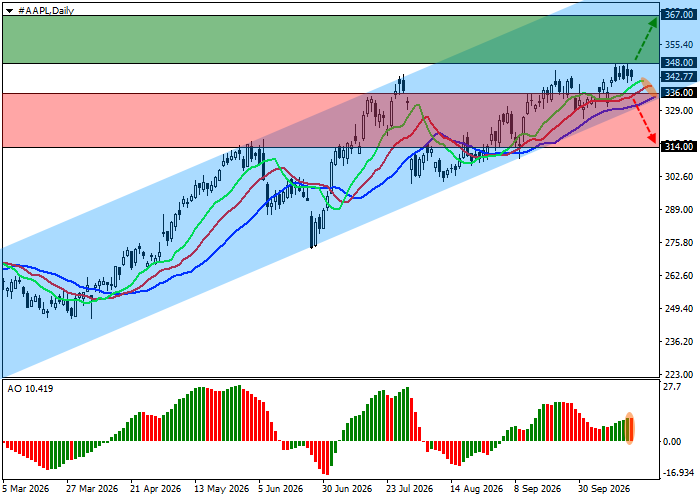
On the daily chart, the price remains within an ascending channel with dynamic boundaries at 380.00–330.00 and is currently attempting to continue its advance toward the resistance line, extending the upward movement discussed in our previous Apple stock forecast. On the four-hour chart, if the price consolidates above the recent high near 348.00, a move toward 367.00 is expected. However, a break below the 335.00 level could trigger a more pronounced downward correction.
Technical indicators are preparing to strengthen their buy signal: the fast exponential moving averages (EMAs) of the Alligator indicator remain above the slow ones, while the Awesome Oscillator (AO) histogram is forming corrective bars in positive territory.
Apple Stock Trading Scenarios and Price Forecast
Long positions may be opened after the price rises and consolidates above 348.00, with a target at 367.00 and a stop-loss at 340.00. Estimated implementation period: 7 days or more.
Short positions may be opened after the price declines and consolidates below 336.00, with a target at 314.00. Stop-loss: 347.00.
Scenario
| Timeframe | Weekly |
| Recommendation | BUY STOP |
| Entry Point | 348.00 |
| Take Profit | 367.00 |
| Stop Loss | 340.00 |
| Key Levels | 314.00, 336.00, 348.00, 367.00 |
Alternative Scenario
| Recommendation | SELL STOP |
| Entry Point | 336.00 |
| Take Profit | 314.00 |
| Stop Loss | 347.00 |
| Key Levels | 314.00, 336.00, 348.00, 367.00 |
