

Monetary policy remains the main factor influencing the pair. At its September meeting, the Reserve Bank of Australia (RBA) raised the cash rate to 4.60%, as policymakers remained concerned about inflation staying above the central bank's 2.0–3.0% target range. The ongoing conflict in the Middle East, which has kept oil prices above 100.00 per barrel, continues to add to inflationary pressure. Nevertheless, analysts believe the measures already taken may prove insufficient, and another 25-basis-point increase in borrowing costs remains possible before the end of the year if consumer prices continue to rise. RBA officials still face the difficult task of balancing inflation control against the need to support economic recovery. For now, containing price pressures remains the priority, although concerns about slowing growth are limiting support for the Australian dollar. Similar factors affecting the currency pair were discussed in our previous AUD/USD forecast.
The US dollar, another key driver of the pair, is trading near 101.50 on the US Dollar Index (USDX) in the market snapshot, influenced by developments in the Treasury market and expectations surrounding Federal Reserve monetary policy. Escalating geopolitical tensions in the Persian Gulf pushed oil prices toward 107.00 per barrel yesterday, increasing concerns about a renewed acceleration in US consumer inflation. Meanwhile, uncertainty over the Fed's next steps has contributed to volatility in government bond yields. Benchmark 10-year US Treasury yields recorded their largest weekly decline since February, as investors increased demand for safer assets, temporarily limiting the dollar's gains. Against this backdrop, the probability of an interest rate increase at the October 28 Federal Reserve meeting remains relatively low. According to the cited CME FedWatch Tool snapshot, it stood at approximately 18.8%, compared with 21.0% a week earlier.
Support and resistance levels
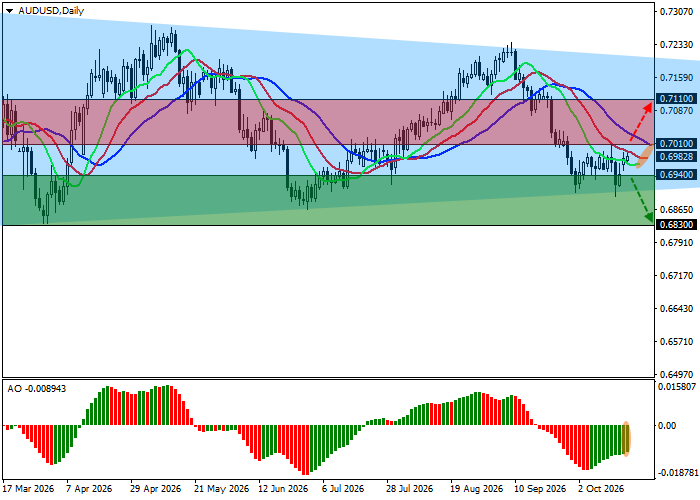
On the daily chart, the trading instrument is correcting above the support line of a broad triangle pattern with dynamic boundaries at 0.7200–0.6900.
Technical indicators have maintained a sell signal since the beginning of September: the fast exponential moving averages (EMAs) of the Alligator indicator are pointing downward, maintaining their distance from the slow ones, while the Awesome Oscillator (AO) histogram is forming corrective bars below the zero line.
Support levels: 0.6940, 0.6830.
Resistance levels: 0.7010, 0.7110.
 AUD/USD Trading Scenarios and Exchange Rate Forecast
Short positions may be opened after the price declines and consolidates below 0.6940, with a target at 0.6830. Stop-loss: 0.7000. Estimated implementation period: 7 days or more.
Long positions may be opened after the price rises and consolidates above 0.7010, with a target at 0.7110. Stop-loss: 0.6930.
Scenario
| Timeframe | Weekly |
| Recommendation | SELL STOP |
| Entry Point | 0.6940 |
| Take Profit | 0.6830 |
| Stop Loss | 0.7000 |
| Key Levels | 0.6830, 0.6940, 0.7010, 0.7110 |
Alternative Scenario
| Recommendation | BUY STOP |
| Entry Point | 0.7010 |
| Take Profit | 0.7110 |
| Stop Loss | 0.6930 |
| Key Levels | 0.6830, 0.6940, 0.7010, 0.7110 |
