

Investors are focusing on the upcoming third-quarter earnings report from aerospace and technology company Space Exploration Technologies Corp. (SpaceX), its second quarterly financial release since becoming an independent publicly traded company. In the previous quarter, revenue reached $7.8 billion, representing a 92.0% increase year-on-year, and analysts expect growth to accelerate further as the company works toward an annualized revenue run rate of $100.0 billion by the end of the year. Meanwhile, aircraft engine manufacturer GE Aerospace is expected to report revenue growth from $12.63 billion to $12.85 billion, while earnings per share (EPS) may decline slightly from $2.02 to $2.00. Similar figures for aerospace and defense company RTX Corp. are projected to decrease from $24.70 billion to $24.09 billion in revenue and from $1.89 to $1.78 in EPS. The importance of corporate earnings and monetary policy expectations for the index was also highlighted in our previous Dow Jones forecast.
The US Treasury market has shown signs of stabilisation after the recent decline in bond yields, providing some support to equity valuations. The benchmark 10-year Treasury yield stands near 5.15%, compared with approximately 5.20% in the earlier market snapshot. Meanwhile, the yield on longer-term 20-year securities has decreased toward 5.53% from around 5.57%, while 30-year government bonds yield approximately 5.48%, compared with 5.50% previously. Although borrowing costs remain elevated, their retreat from recent highs has helped reduce pressure on the stock market.
Among the companies showing positive performance were Amazon.com Inc. (+4.98%), IBM Corp. (+1.83%), Nvidia Corp. (+1.38%), UnitedHealth Group Inc. (+1.36%) and American Express Co. (+0.90%).
Stocks under pressure included JPMorgan Chase & Co. (–1.82%), Amgen Inc. (–1.75%), 3M Company (–1.66%) and Merck & Co. Inc. (–1.59%). Outside the Dow Jones index, Verizon Communications Inc. also declined by 1.43%.
Support and resistance levels
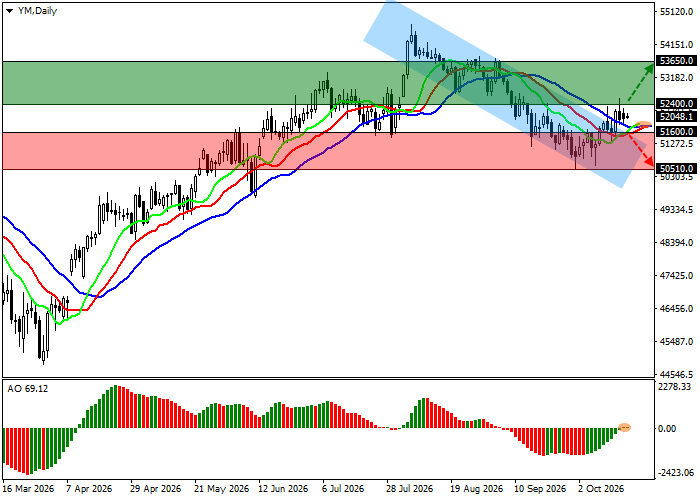
On the daily chart, the trading instrument is moving higher from the resistance line of a local descending channel with dynamic boundaries at 52000.0–50500.0.
Technical indicators have maintained a buy signal since the beginning of the month: the exponential moving averages (EMAs) of the Alligator indicator are widening in the upward direction, while the Awesome Oscillator (AO) histogram is forming corrective bars in positive territory.
Support levels: 51600.0, 50510.0.
Resistance levels: 52400.0, 53650.0.
Dow Jones Trading Scenarios and DJIA Forecast
Long positions may be opened after the price rises and breaks above 52400.0, with a target at 53650.0 and a stop-loss at 52000.0. Estimated implementation period: 7 days or more.
Short positions may be opened after the price declines and consolidates below 51600.0, with a target at 50510.0. Stop-loss: 52000.0.
Scenario
| Timeframe | Weekly |
| Recommendation | BUY STOP |
| Entry Point | 52400.0 |
| Take Profit | 53650.0 |
| Stop Loss | 52000.0 |
| Key Levels | 50510.0, 51600.0, 52400.0, 53650.0 |
Alternative Scenario
| Recommendation | SELL STOP |
| Entry Point | 51600.0 |
| Take Profit | 50510.0 |
| Stop Loss | 52000.0 |
| Key Levels | 50510.0, 51600.0, 52400.0, 53650.0 |
