

Technical indicators provide mixed signals: the Bollinger Bands are pointing downward, the MACD histogram remains stable in negative territory, while the Stochastic oscillator has shifted to sideways movement. On the weekly chart, the Bollinger Bands are also turning lower, indicating the development of a correction within the long-term upward trend and increasing the likelihood of further price declines.
Support and resistance levels
Resistance levels: 4296.88, 4531.25, 4765.62.
Support levels: 4140.62, 3984.38, 3750.00.
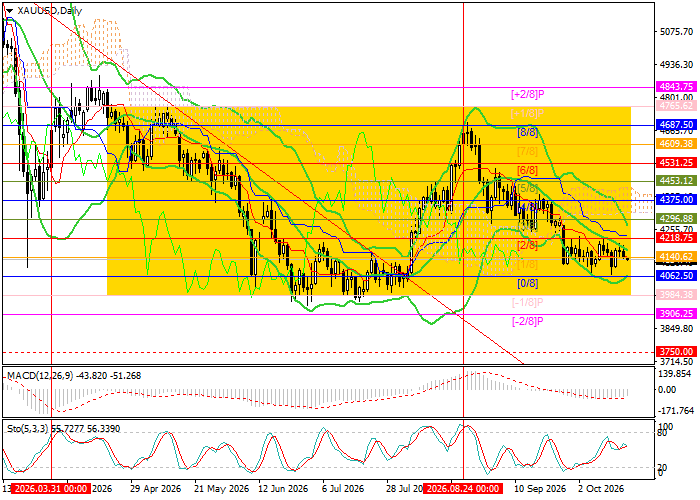
XAU/USD Trading Scenarios and Gold Price Forecast
Short positions may be opened below 4140.62, with targets at 3984.38 and 3750.00 and a stop-loss at 4255.00. Estimated implementation period: 5–7 days.
Long positions may be opened above 4296.88, with targets at 4531.25 and 4765.62 and a stop-loss at 4170.00.
Scenario
| Timeframe | Weekly |
| Recommendation | SELL |
| Entry Point | 4123.96 |
| Take Profit | 3984.38, 3750.00 |
| Stop Loss | 4255.00 |
| Key Levels | 3750.00, 3984.38, 4140.62, 4296.88, 4531.25, 4765.62 |
Alternative Scenario
| Recommendation | BUY STOP |
| Entry Point | 4296.88 |
| Take Profit | 4531.25, 4765.62 |
| Stop Loss | 4170.00 |
| Key Levels | 3750.00, 3984.38, 4140.62, 4296.88, 4531.25, 4765.62 |
