

In particular, tomorrow at 08:00 (GMT+2), market participants will focus on UK labor market data, which will undoubtedly influence the rhetoric of monetary authorities ahead of the April 30 meeting. For now, investors expect a 25-basis-point rate hike by September and see the probability of a second move of the same size before year-end at 45.0%. Overall, preliminary estimates suggest employment will show modest growth of 50.0K–60.0K, weaker than January’s 84.0K, while the number of unemployment benefit claims in March may rise by 21.4K after a revised decline of 24.7K in the previous month. Average hourly earnings excluding bonuses are expected to slow from 3.8% to 3.5%, and including bonuses from 3.8% to 3.6%, while the unemployment rate is likely to hold near 5.2%. The most important release for determining the future direction of monetary policy will clearly be the March inflation report, due on Wednesday at 08:00 (GMT+2): current forecasts point to a significant acceleration in price growth as the economy reacts to the Middle East crisis, which has driven a substantial increase in energy prices. Headline inflation is likely to rise from 3.0% to 3.3% year-on-year, while the core figure may come in around 3.2%. For now, however, the market remains focused on GDP data published last week. The UK economy expanded by 0.5% in February, significantly above forecasts, although the figure does not yet reflect the sharp moves seen in commodity markets in March.
Meanwhile, in its updated outlook, the International Monetary Fund (IMF) recorded a noticeable deterioration in global macroeconomic conditions amid the escalation of the Middle East conflict and the rise in the geopolitical premium embedded in energy prices. The baseline scenario assumes a short but acute phase of the US-Iran confrontation and keeps global GDP growth at 3.1% this year versus the previously expected 3.3%, equivalent to a downgrade of 0.2 percentage points. Without the military factor, however, the estimate of potential growth would have been revised up to 3.4% thanks to faster investment in the technology sector and easing financial conditions. The forecast for the UK this year has been cut to 0.8% from January’s 1.3%, the weakest among the G7 countries. Bank of England Governor Andrew Bailey, speaking at the IMF meeting in Washington, warned that the global economy is facing a “very large energy shock” that will fuel inflation, and in the United Kingdom it could reach 4.0%, double the target level. At the same time, he stressed that the regulator “will not rush to judgment” or respond to every spike in consumer prices, especially given the Fund’s warning that a balanced approach is needed in response to new challenges.
Last week’s macroeconomic data failed to give the US dollar a clear bullish impulse: initial jobless claims fell to 207.0K, pointing to continued resilience in the labor market, but industrial production dropped by 0.5% in March, significantly worse than analysts had expected. The US Federal Reserve is expected to keep interest rates unchanged in the 3.50–3.75% range at its April 28–29 meeting, as the minutes of the March meeting showed that although most officials still expect a return to a dovish course, geopolitical uncertainty remains a key risk to the economy and may require tighter monetary conditions.
Support and resistance levels
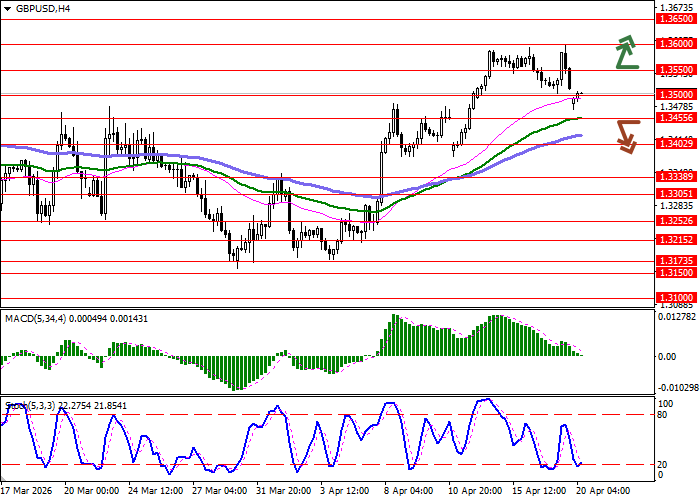
On the daily chart, Bollinger Bands are showing confident growth: the price range is expanding and remains wide enough for the current level of activity. MACD is turning into a downward plane, forming a new sell signal and attempting to settle below the signal line. Stochastic is showing a similar pattern, retreating sharply from overbought territory, which points to risks of sterling being overbought in the ultra-short term.
Resistance levels: 1.3550, 1.3600, 1.3650, 1.3700.
Support levels: 1.3500, 1.3455, 1.3402, 1.3338.
Trading scenarios and GBP/USD forecast
Short positions may be opened after a confident breakout below 1.3455 with a target at 1.3338. Stop-loss: 1.3500. Timeframe: 2–3 days.
A continuation of the corrective rise followed by a breakout above 1.3550 may become a signal to open long positions with a target at 1.3650. Stop-loss: 1.3500.
Scenario
| Timeframe | Intraday |
| Recommendation | SELL STOP |
| Entry Point | 1.3450 |
| Take Profit | 1.3338 |
| Stop Loss | 1.3500 |
| Key Levels | 1.3338, 1.3402, 1.3455, 1.3500, 1.3550, 1.3600, 1.3650, 1.3700 |
Alternative Scenario
| Recommendation | BUY STOP |
| Entry Point | 1.3555 |
| Take Profit | 1.3650 |
| Stop Loss | 1.3500 |
| Key Levels | 1.3338, 1.3402, 1.3455, 1.3500, 1.3550, 1.3600, 1.3650, 1.3700 |
