

The key factor supporting the stock market now is the completed corporate reporting season, as well as investors’ confirmed concerns about persistently high inflation. Thus, May statistics recorded a slowdown in the monthly consumer price index by 0.2% and annual growth of 2.6%, while the harmonized indicator adjusted by –0.1% and increased by 2.7%, respectively. The key drivers of inflation, as in previous periods, were higher energy prices, which rose by 6.6% compared to May 2025 due to the blockade of the strategically important sea route — the Strait of Hormuz, through which around 20.0% of global crude oil volumes had been transported before the start of the Middle East crisis. Nevertheless, the annual increase was lower than in April 2026 (10.1%).
The current situation in the debt market is not yet contributing to a decline in demand for real assets, as yields across the entire range of leading bonds remain in a neutral zone this week: two-year securities are trading at 2.472%, slightly below the 2.534% recorded at the end of last week; 10-year bonds are at 2.999% versus 3.059%; while 20-year and 30-year bonds are at 3.478% and 3.554% compared with 3.533% and 3.607%, respectively.
The growth leaders in the index are Deutsche Bank AG (+6.60%), Heidelberg Materials AG (+5.14%), Siemens Energy AG (+4.48%), Infineon Technologies AG (+3.89%), and Continental AG (+3.64%).
Among the main decliners are Zalando SE (–1.87%), Merck KGaA (–1.59%), Hannover Rück SE (–1.21%), Rheinmetall AG (–1.18%), and Symrise AG (–1.01%).
Support and Resistance Levels
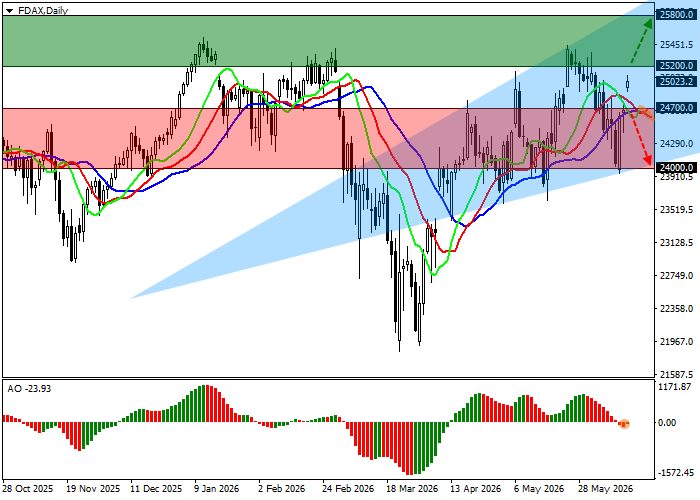
On the daily chart, the instrument is trading within a corrective trend, moving away from the support line of the “broadening formation” pattern with boundaries at 24500.0–24000.0, the formation of which began back in early April.
Technical indicators are slowing the sell signal received last week: the fast EMAs on the Alligator indicator remain below the signal line, while the AO histogram is forming corrective bars in the negative zone.
Support levels: 24700.0, 24000.0.
Resistance levels: 25200.0, 25800.0.
Trading Scenarios and DAX 40 Forecast
Long positions may be opened after the price consolidates above 25200.0, with the target at 25800.0. Stop-loss — 24900.0. Implementation period: 7 days or more.
Short positions may be opened after the price consolidates below 24700.0, with the target at 24000.0. Stop-loss — 25000.0.
Scenario
| Timeframe | Weekly |
| Recommendation | BUY STOP |
| Entry Point | 25200.5 |
| Take Profit | 25800.0 |
| Stop Loss | 24900.0 |
| Key Levels | 24000.0, 24700.0, 25200.0, 25800.0 |
Alternative Scenario
| Recommendation | SELL STOP |
| Entry Point | 24699.5 |
| Take Profit | 24000.0 |
| Stop Loss | 25000.0 |
| Key Levels | 24000.0, 24700.0, 25200.0, 25800.0 |
