

Germany’s Ifo Business Climate Index rose from a revised 85.7 to 86.6, exceeding market expectations of 86.0. The Business Expectations Index also increased sharply from 84.3 to 86.7, while the Current Assessment Index declined from 87.0 to 86.5.
Commenting on the figures, Ifo President Clemens Fuest said that despite continued uncertainty surrounding the Persian Gulf, the German economy was showing less pessimism. However, the data have so far provided only limited support to the euro, as market participants remain cautious ahead of this week’s key event — the US Federal Reserve meeting.
The regulator will announce its monetary policy decision on Wednesday at 20:00 (GMT+2). Most analysts expect officials to leave the federal funds target range unchanged at 3.50–3.75%, although the possibility of an immediate rate increase cannot be completely ruled out. Investors will therefore focus primarily on the accompanying statement and comments from officials for signals regarding further monetary tightening.
According to the CME FedWatch Tool, markets assign a high probability to at least one 25-basis-point rate increase by September, while additional tightening may follow later in the year. Money markets have also been pricing in another European Central Bank rate increase, potentially as early as September.
Overall, the fundamental backdrop continues to support a moderately bearish bias in EUR/USD, although expectations of tighter policy from both the Fed and the ECB limit the strength of the signal.
Support and Resistance Levels
The trading instrument remains within a descending channel and the sideways range of 1.1474–1.1352. The 1.1352 level, also highlighted in FORECK.INFO’s recent EUR/USD forecast focused on ECB inflation risks, remains the key support level.
A confirmed breakdown below 1.1352 (Murrey level [2/8]), which was tested last month, could lead to further losses toward 1.1230 (Murrey level [0/8]), 1.1108 (Murrey level [–2/8]) and 1.0986 (Murrey level [5/8], W1).
Conversely, a breakout above the upper Bollinger Band at 1.1474 (Murrey level [4/8]) could signal a reversal of the current trend and support gains toward 1.1718 (Murrey level [8/8]), 1.1840 (Murrey level [+2/8]) and 1.1962 (Murrey level [+1/8], W1).
Technical indicators do not provide a unified signal: the Bollinger Bands are turning sideways, the MACD histogram remains stable below the zero line, while the Stochastic Oscillator is reversing upward from oversold territory.
Resistance levels: 1.1474, 1.1718, 1.1840, 1.1962.
Support levels: 1.1352, 1.1230, 1.1108, 1.0986.
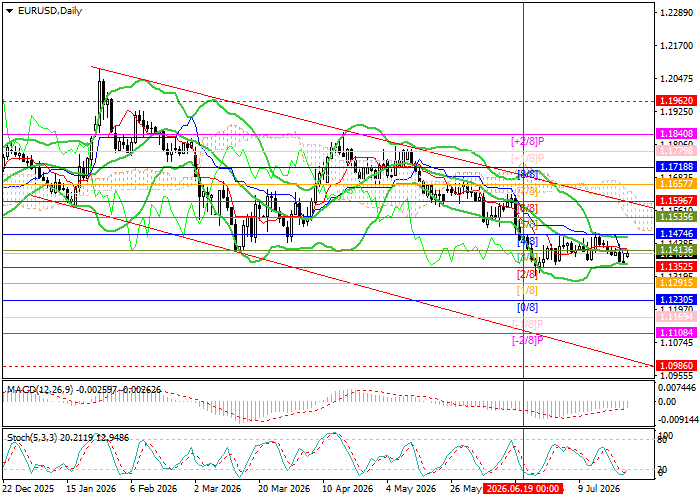
EUR/USD Trading Scenarios and Exchange Rate Forecast
Short positions may be considered below 1.1352, with targets at 1.1230, 1.1108 and 1.0986 and a stop-loss at 1.1440. Implementation period: 5–7 days. Long positions may be considered above 1.1474, with targets at 1.1718, 1.1840 and 1.1962 and a stop-loss at 1.1370.
Scenario
| Timeframe | Weekly |
| Recommendation | SELL STOP |
| Entry Point | 1.1352 |
| Take Profit | 1.1230, 1.1108, 1.0986 |
| Stop Loss | 1.1440 |
| Key Levels | 1.0986, 1.1108, 1.1230, 1.1352, 1.1474, 1.1718, 1.1840, 1.1962 |
Alternative Scenario
| Recommendation | BUY STOP |
| Entry Point | 1.1474 |
| Take Profit | 1.1718, 1.1840, 1.1962 |
| Stop Loss | 1.1370 |
| Key Levels | 1.0986, 1.1108, 1.1230, 1.1352, 1.1474, 1.1718, 1.1840, 1.1962 |
