

Representatives of Iran’s Foreign Ministry noted that the U.S. attacks nullify the ceasefire agreement reached in April, while CNN, citing a diplomatic source, reports that negotiations between Washington and Tehran are continuing. The Islamic Revolutionary Guard Corps stated that the Strait of Hormuz is completely blocked, adding that any vessel attempting to pass through the waters will be attacked, citing the changed security situation. Shortly after these comments, state media reported that two vessels spotted in the strait had already come under fire.
According to experts at UBS Group AG, British equities still have growth potential, and their rating remains at “neutral.” Analysts point to the limited share of the industrial segment and the market’s significant focus on the energy sector, whose companies account for more than 20.0% of the index. Thus, rising hydrocarbon prices support quotes, while the manufacturing industry, although currently acting as a restraining factor, may become the main driver of the asset’s strengthening after the situation in the Persian Gulf region is resolved.
The expected reaction to rising geopolitical tensions is an upward correction in government bonds: over the week, the yield on short-term one-year securities increased from 4.165% to 4.188%, popular 10-year bonds from 4.882% to 4.910%, conservative 20-year bonds from 5.502% to 5.526%, and global 30-year bonds from 5.562% to 5.591%.
In addition, the index is positively affected by the neutral position of the Bank of England, which is in no hurry to raise interest rates, although most global regulators have already announced plans to tighten monetary policy in response to rising inflation.
Among the current growth leaders are Standard Chartered Plc. (+3.41%), Airtel Africa Plc. (+2.65%), Prudential Plc. (+2.53%), Anglo American Plc. (+2.48%), and HSBC Holdings Plc. (+2.20%).
The biggest declines were recorded by Halma Plc. (–15.38%), Sage Group Plc. (–5.25%), ICG Plc. (–4.67%), Relx Plc. (–3.38%), and Auto Trader Group Plc. (–3.16%).
Support and resistance levels
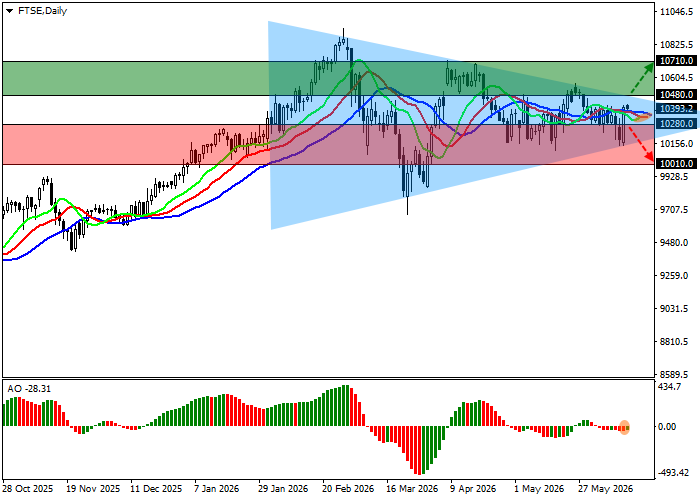
On the daily chart, the trading instrument is approaching the resistance line of the triangle pattern with boundaries at 10500.0–10000.0.
Technical indicators are weakening the sell signal: the EMA fluctuation range of the Alligator indicator is narrowing, while the AO histogram is forming corrective bars below the transition level.
Resistance levels: 10480.0, 10710.0.
Support levels: 10280.0, 10010.0.
FTSE 100 trading scenarios and forecast
Long positions may be opened after the price rises and consolidates above 10480.0, with a target at 10710.0 and a stop-loss at 10200.0. Expected timeframe: 7 days or more. Short positions may be opened after the price declines and consolidates below 10280.0, with a target at 10010.0. Stop-loss — 10400.0.
Scenario
| Timeframe | Weekly |
| Recommendation | BUY STOP |
| Entry point | 10480.0 |
| Take Profit | 10710.0 |
| Stop Loss | 10200.0 |
| Key levels | 10010.0, 10280.0, 10480.0, 10710.0 |
Alternative scenario
| Recommendation | SELL STOP |
| Entry point | 10280.0 |
| Take Profit | 10010.0 |
| Stop Loss | 10400.0 |
| Key levels | 10010.0, 10280.0, 10480.0, 10710.0 |
