

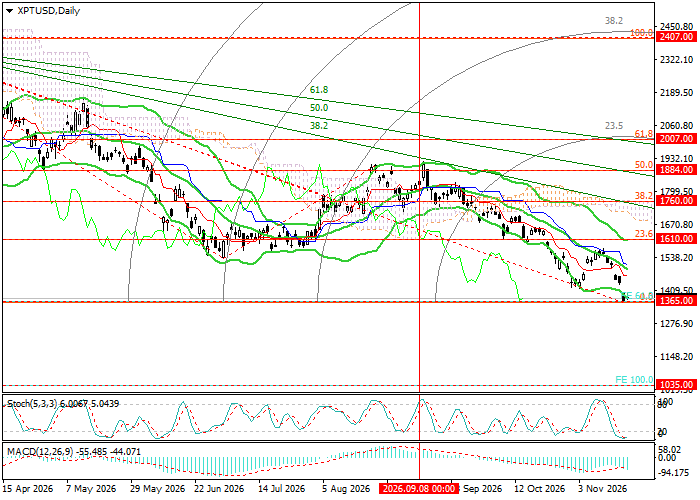
XPT/USD, daily chart (D1)
Platinum remains in a long-term downtrend on the daily chart. The move below $1,365, where the 0% Fibonacci retracement meets the 61.8% extension, brings the 100% extension at $1,035 into view. A stronger recovery would need to clear the descending Fibonacci fan and the upper Bollinger Band near $1,610, which aligns with the 23.6% retracement. The next daily resistance levels would then be $1,884 and $2,007, the 50% and 61.8% retracements.
The Bollinger Bands are sloping lower. The daily MACD histogram remains below zero, with shorter negative bars. The Stochastic oscillator is oversold, leaving room for a limited rebound.
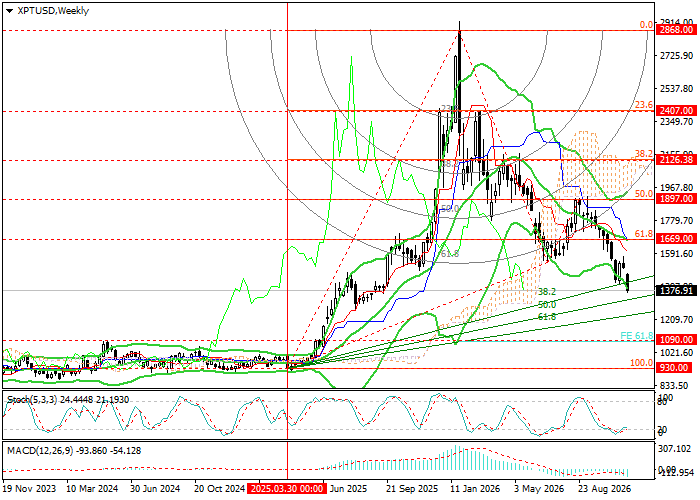
XPT/USD, weekly chart (W1)
Platinum lost about 12.6% over the week. On the weekly chart, the decline from $1,897, the 50% Fibonacci retracement, is part of a correction within a longer-term uptrend. The price has moved below $1,669, where the 61.8% retracement meets the middle Bollinger Band. A confirmed break through the rising Fibonacci fan would put $1,090, the 61.8% extension, and $930, the 100% retracement, in focus.
A sustained recovery above $1,669 would bring $1,897 back into view, followed by $2,126.38 and $2,407 at the 38.2% and 23.6% weekly retracements. The weekly Bollinger Bands are still sloping lower and the MACD histogram is extending farther below zero. The Stochastic oscillator is oversold.
The medium-term bias remains bearish. With $1,365 now above the market, the downside levels are $1,090, $1,035 and $930. A sustained move above $1,669 would bring the $1,890 area into view, where the daily and weekly 50% retracements cluster. The next recovery targets are $2,007 and $2,407. The latter aligns with the weekly 23.6% retracement and the daily 100% retracement.
Support levels — $1,090, $1,035 and $930.
Resistance levels — $1,365, $1,610, $1,669, $1,890, $2,007 and $2,407.
XPT/USD forecast and trading scenarios
Platinum traded below the original $1,310 short trigger on November 20. The setup’s targets are $1,090, $1,035 and $930, with an original stop-loss at $1,510 and an estimated timeframe of 5–7 days.
The alternative long scenario requires a sustained recovery above $1,669. Its targets are $1,890, $2,007 and $2,407, with a stop-loss at $1,570.
Downside scenario
| Timeframe | Weekly |
| Status | Entry level breached on November 20 |
| Original order | SELL STOP |
| Original entry level | 1310.00 |
| Take Profit | 1090.00, 1035.00, 930.00 |
| Stop Loss | 1510.00 |
| Key levels | 930.00, 1035.00, 1090.00, 1365.00, 1669.00, 1890.00, 2007.00, 2407.00 |
Alternative scenario
| Order | BUY STOP |
| Entry point | 1669.00 |
| Take Profit | 1890.00, 2007.00, 2407.00 |
| Stop Loss | 1570.00 |
| Key levels | 930.00, 1035.00, 1090.00, 1365.00, 1669.00, 1890.00, 2007.00, 2407.00 |
