

Iranian state media reported that Iran’s navy said three oil tankers had struck mines east of the Strait of Hormuz. The reports renewed concerns about disruptions to Gulf oil shipments. At the same time, the International Energy Agency expects the global oil market to return to surplus in the fourth quarter as Gulf exports recover faster than demand. Its November report showed that tracked global oil inventories rose by 52 million barrels in October.
US crude output rose by 19,000 barrels per day to 14.032 million barrels per day in the week ended November 13. Commercial crude inventories increased by 3.38 million barrels to 417.8 million, following a 4.66-million-barrel build the previous week. The Strategic Petroleum Reserve fell by about 3.2 million barrels to 276.4 million. The American Petroleum Institute’s separate estimate showed a 5.3-million-barrel increase in crude inventories after a 9.0-million-barrel rise the week before. EIA Weekly Petroleum Status Report.
CME Group described the November 17 rebound in December WTI futures as a low-volume move. Its following session’s commentary noted that open interest had fallen to its lowest level since 2024 as January WTI traded below $83.
Support and resistance levels
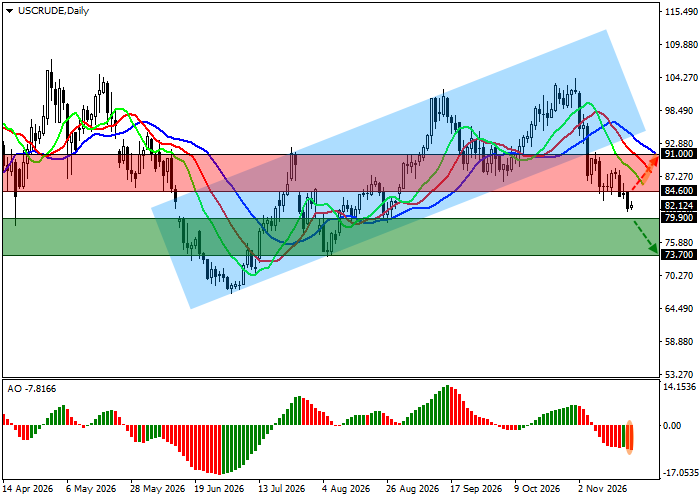
On the daily chart, WTI remains well below the lower boundary of its former rising channel, which ran between $91.00 and $111.00. The next support is at $79.90, followed by $73.70. A recovery through $84.60 would bring the former channel floor at $91.00 back into view.
The Alligator’s faster moving averages remain well below its slower lines. The Awesome Oscillator histogram is moving farther below zero, reinforcing the bearish bias.
Support levels — $79.90 and $73.70.
Resistance levels — $84.60 and $91.00.
WTI crude oil forecast and trading scenarios
A sustained break below $79.90 would activate the short scenario, with a target at $73.70 and a stop-loss at $83.00. The estimated timeframe is seven days or more.
A sustained move above $84.60 would activate the alternative long scenario, with a target at $91.00 and a stop-loss at $81.00.
Scenario
| Timeframe | Weekly |
| Recommendation | SELL STOP |
| Entry point | 79.90 |
| Take Profit | 73.70 |
| Stop Loss | 83.00 |
| Key levels | 73.70, 79.90, 84.60, 91.00 |
Alternative scenario
| Recommendation | BUY STOP |
| Entry point | 84.60 |
| Take Profit | 91.00 |
| Stop Loss | 81.00 |
| Key levels | 73.70, 79.90, 84.60, 91.00 |
