

Japan’s exports rose 20.5% year on year in October, above the 20.0% forecast, and reached a record ¥11.77 trillion. Shipments to the US increased 23.9% and exports to China rose 13.3%. Strong demand for semiconductors and chipmaking equipment helped drive the increase as global investment in AI infrastructure continued. Imports rose 21.6% to ¥12.25 trillion, below the 25.8% forecast. The unadjusted trade deficit narrowed to ¥476.5 billion from a revised ¥556.5 billion in September. Japan’s official October trade report.
Speaking in parliament on November 18, Bank of Japan Governor Kazuo Ueda said further rate increases remained appropriate because financial conditions were still accommodative. He said the proposed cut in consumption tax on food could support growth by lifting households’ real purchasing power. The effect would depend partly on how businesses set prices and how households respond. On November 19, Ueda also said he expected consumer spending to recover and warned that a weak yen could push inflation above target by raising prices across a wider range of goods.
In the US, October retail sales rose 0.2% month on month after a 0.8% gain in September. The retail sales control group, which excludes motor vehicles, petrol, building materials and food services, rose 0.6% against a 0.4% forecast. The Federal Reserve’s October meeting minutes, published on November 18, showed that nearly all participants saw further rate increases as likely under their baseline outlooks. On November 19, futures pricing reported by MarketWatch implied a 90.7% chance of a quarter-point rise in December and a 73.8% chance of at least another quarter-point increase in January.
Expectations of further US tightening support the case for a renewed advance in USD/JPY. The approach to 160.00 also keeps traders alert to possible Japanese currency intervention.
Support and resistance levels
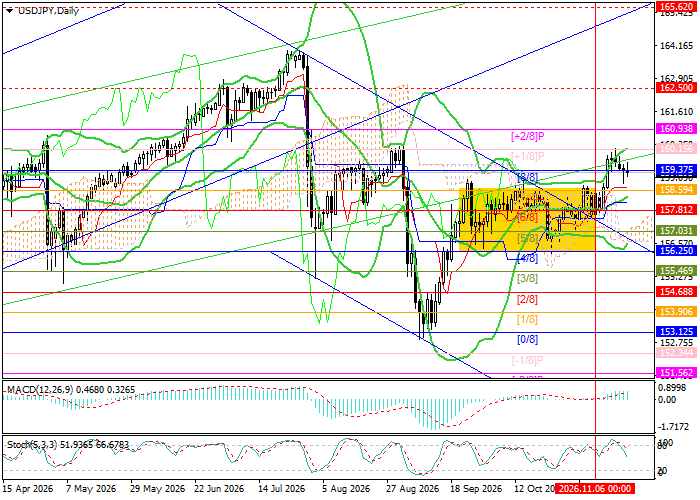
USD/JPY remains above its former 156.25–158.59 range, bounded by the Murrey Math [4/8] and [7/8] levels. A sustained break above 160.15, the [+1/8] level, would bring 162.50 and 165.62 into view, corresponding to the weekly [4/8] and [5/8] levels. A break below 156.25 would expose 153.12 (Murrey Math [0/8]) and 151.56 (Murrey Math [−2/8]).
The Bollinger Bands are turning higher and the MACD histogram is expanding in positive territory. The Stochastic oscillator is moving out of the overbought zone, leaving room for a short-term pullback.
Resistance levels — 160.15, 162.50 and 165.62.
Support levels — 156.25, 153.12 and 151.56.
USD/JPY forecast and trading scenarios
A sustained move above 160.15 would activate the long scenario, with targets at 162.50 and 165.62 and a stop-loss at 159.10. The estimated timeframe is 5–7 days.
A break below 156.25 would activate the alternative short scenario, with targets at 153.12 and 151.56 and a stop-loss at 158.00.
Scenario
| Timeframe | Weekly |
| Recommendation | BUY STOP |
| Entry point | 160.15 |
| Take Profit | 162.50, 165.62 |
| Stop Loss | 159.10 |
| Key levels | 151.56, 153.12, 156.25, 160.15, 162.50, 165.62 |
Alternative scenario
| Recommendation | SELL STOP |
| Entry point | 156.25 |
| Take Profit | 153.12, 151.56 |
| Stop Loss | 158.00 |
| Key levels | 151.56, 153.12, 156.25, 160.15, 162.50, 165.62 |
