

Anthropic’s Nasdaq debut put AI valuations in focus. The Claude developer priced its IPO at $83 a share, above the marketed range of $70–$78. The initial offering was worth $81.3 billion, surpassing the $75 billion SpaceX raised when it priced its June IPO. Anthropic opened at $111.50 on November 19, valuing the company at about $1.5 trillion based on outstanding shares, and ended its first session at $97.17.
After underwriters exercised their option to buy additional shares, the IPO closed on November 20 with $93.5 billion in gross proceeds, of which about $91.6 billion went to Anthropic before fees. The company also completed a separate $26 billion private placement with investors including Google, AMD, Microsoft and Nvidia. The two transactions brought about $117.6 billion in gross proceeds to Anthropic. Technology shares slid on Friday, and the Nasdaq Composite closed 5.28% lower.
US Treasury yields fell as investors sought safety, while futures continued to point to a quarter-point Fed hike in December as the most likely outcome. Between November 13 and 20, the one-year yield fell from 4.65% to 4.51%, the 10-year from 5.15% to 4.92%, the 20-year from 5.52% to 5.34% and the 30-year from 5.47% to 5.31%. US Treasury daily yield data.
UnitedHealth Group (+2.84%), Verizon (+1.62%) and Walmart (+1.52%) were among the stocks that rose on Friday. Nvidia (−14.01%) and Broadcom (−12.19%) were the two biggest drags on the S&P 500 in index points, followed by Micron Technology.
Support and resistance levels
On the daily chart, the S&P 500 has extended its decline below the former rising channel, which spanned 7,310–7,900. Friday’s session took the index through the 7,080 support level and down to around 6,883. The next downside level is 6,820. On a rebound, 7,080 is the first level to reclaim, followed by 7,200 and 7,420.
The Alligator’s faster moving averages remain below its slower lines, and the Awesome Oscillator histogram continues to form corrective bars below zero. The technical bias remains bearish.
Support level — 6,820.
Resistance levels — 7,080, 7,200 and 7,420.
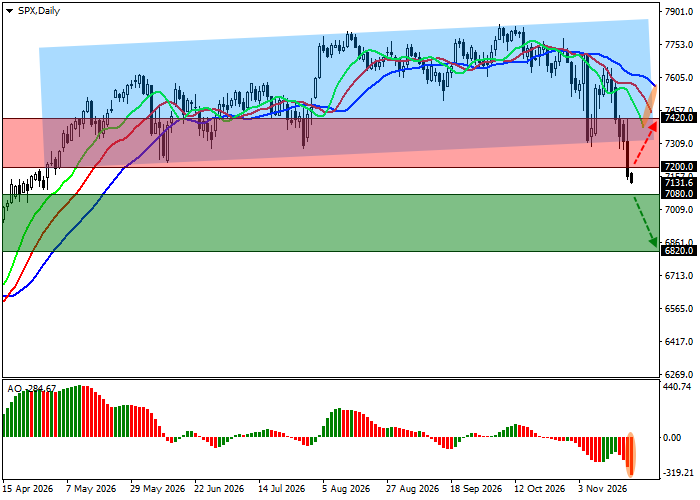
S&P 500 forecast and trading scenarios
The index crossed the original short trigger at 7,080 on November 20. The downside target for that setup is 6,820, with an original stop-loss at 7,170 and an estimated timeframe of seven days or more.
The alternative long scenario requires a sustained move above 7,200. Its target is 7,420, with a stop-loss at 7,100.
Downside scenario
| Timeframe | Weekly |
| Status | Triggered on November 20 |
| Original order | SELL STOP |
| Original entry level | 7080.0 |
| Take Profit | 6820.0 |
| Stop Loss | 7170.0 |
| Key levels | 6820.0, 7080.0, 7200.0, 7420.0 |
Alternative scenario
| Order | BUY STOP |
| Entry point | 7200.0 |
| Take Profit | 7420.0 |
| Stop Loss | 7100.0 |
| Key levels | 6820.0, 7080.0, 7200.0, 7420.0 |
