

Trading across Wall Street was mixed. Nvidia gave up an early rally after earnings and closed 2.89% lower, while the Nasdaq Composite gained 0.42%. Early on November 19, Dow futures rose about 0.6% as Anthropic priced its IPO above the marketed range, helping restore demand for AI-related stocks.
Walmart reported fiscal third-quarter revenue of $188.8 billion, up 5.2% from a year earlier, with global e-commerce sales rising 17%. Reported earnings were $0.62 per share and adjusted earnings were $0.65 per share. The retailer raised its full-year outlook and now expects adjusted earnings of $2.84–$2.89 per share.
Asian technology earnings showed a mixed picture. Alibaba’s September-quarter revenue rose 10% year on year to RMB271.5 billion, helped by a 53% increase in AI cloud and compute services revenue. Adjusted earnings came to RMB8.10 per American depositary share, below the RMB11.16 consensus tracked by Reuters. NetEase reported third-quarter revenue of RMB27.9 billion ($4.2 billion), down 1.8% year on year. Its adjusted basic earnings declined to $2.13 per American depositary share from $2.22 a year earlier.
The Federal Reserve’s October meeting minutes showed that nearly all participants saw further rate increases as likely if the economy evolved as expected. A 25-basis-point increase in December would take the federal funds target range to 4.00%–4.25%. Treasury yields eased between November 17 and 18. The 10-year yield fell from 5.10% to 5.07%, the 20-year from 5.50% to 5.44% and the 30-year from 5.46% to 5.41%.
Walt Disney (+4.63%), Amazon (+3.82%), Cisco (+2.18%), Honeywell (+1.71%) and Nike (+1.28%) were among the Dow’s strongest performers on November 18.
UnitedHealth Group (−10.21%) led the declines, followed by Chevron (−4.74%), Merck (−3.90%), Amgen (−3.07%) and Nvidia (−2.89%).
Support and resistance levels
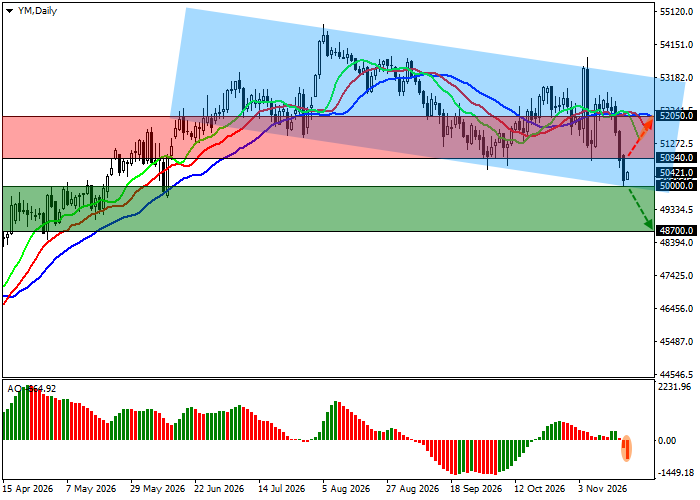
On the daily chart, the Dow is approaching the lower boundary of a short-term descending channel spanning 50,000–53,200. A sustained break below 50,000 would bring 48,700 into view. If the index rebounds, 50,840 is the first resistance, followed by 52,050.
The technical indicators continue to favour the downside. The Alligator’s moving-average lines are widening as they trend lower, while the Awesome Oscillator histogram is forming corrective bars below zero.
Support levels — 50,000 and 48,700.
Resistance levels — 50,840 and 52,050.
Dow Jones forecast and trading scenarios
A sustained break below 50,000 would activate the short scenario, with a target at 48,700 and a stop-loss at 51,000. The estimated timeframe is seven days or more.
A sustained move above 50,840 would activate the alternative long scenario, with a target at 52,050 and a stop-loss at 50,100.
Scenario
| Timeframe | Weekly |
| Recommendation | SELL STOP |
| Entry point | 50000.0 |
| Take Profit | 48700.0 |
| Stop Loss | 51000.0 |
| Key levels | 48700.0, 50000.0, 50840.0, 52050.0 |
Alternative scenario
| Recommendation | BUY STOP |
| Entry point | 50840.0 |
| Take Profit | 52050.0 |
| Stop Loss | 50100.0 |
| Key levels | 48700.0, 50000.0, 50840.0, 52050.0 |
