

This week, despite the current ceasefire, U.S. forces destroyed four unmanned aerial vehicles on Iranian territory and attacked a ground control station in the port city of Bandar Abbas. In response, the Islamic Revolutionary Guard Corps struck a U.S. airbase in Kuwait and said it would respond “symmetrically” to any future violation of the agreements. This casts doubt on the conclusion of a peace deal between the parties to the conflict and puts pressure on assets that act as alternatives to the U.S. dollar. Meanwhile, U.S. President Donald Trump stated this week that the removal of enriched uranium from Iran is not directly linked to the lifting of sanctions. The statement came as both sides intensified efforts to reach a peace agreement aimed at ending the conflict, which has been weighing on the energy sector and the geopolitical situation in the Persian Gulf for more than three months. At the same time, the crisis continues to slow global economic growth and increases the risk that inflation could remain near peak levels for longer than previously expected. However, the U.S. president also wrote on Truth Social that the negotiation process is generally “going very well,” sending mixed signals to the market and preventing investors from choosing a clear direction for future capital allocation.
The corporate earnings season is now coming to an end. Yesterday, Dell Technologies Inc., one of the largest computer hardware manufacturers, reported revenue of 48.3 billion dollars, above analysts’ expectations of 34.81 billion dollars and significantly higher than 23.38 billion dollars recorded in the same period last year. Earnings per share came in at 4.86 dollars, compared with 2.88 dollars expected and 1.37 dollars a year earlier. Autodesk Inc., a provider of software for industrial and civil construction, mechanical engineering, media, and entertainment, reported revenue of 1.93 billion dollars, up from 1.76 billion dollars in the same period last year, while EPS reached 2.99 dollars versus 2.29 dollars last year. The global leader in data infrastructure and cloud solutions reported figures of 1.95 billion dollars in revenue and 2.43 dollars in EPS, compared with 1.73 billion dollars and 1.93 dollars, respectively.
As for the bond market, the yield on the most popular 12-month securities is currently around 3.793%, down from 3.855% last Friday. The yield on 10-year bonds stands at 4.436% versus 4.578%, while 20-year and 30-year yields are at 4.963% and 4.965%, compared with 5.104% and 5.088%, respectively.
The top gainers in the index are Dollar Tree Inc. (+17.87%), Agilent Technologies Inc. (+16.87%), Best Buy Co., Inc. (+15.80%), Hormel Foods Corp. (+12.55%), and Axon Enterprise Inc. (+12.27%).
The main decliners are Synopsys Inc. (–8.61%), Tyson Foods Inc. (–6.09%), Norfolk Southern Corp. (–5.47%), Union Pacific Corp. (–4.43%), and Corning Inc. (–4.15%).
Support and resistance levels
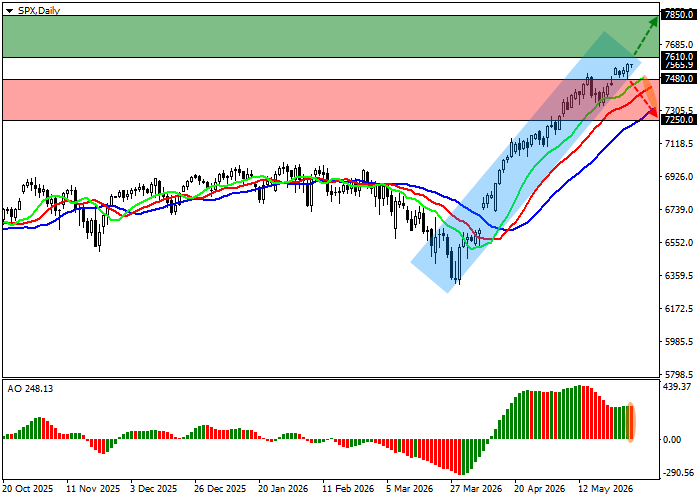
On the daily chart, quotes are moving within a corrective trend and have made a local attempt to approach the upper boundary of the ascending channel at 7600.0–7400.0.
Technical indicators remain in a stable buy signal: the fast EMAs on the Alligator indicator are fixed above the signal line, while the AO histogram is forming corrective bars in the buying zone.
Support levels: 7480.0, 7250.0.
Resistance levels: 7610.0, 7850.0.
S&P 500 trading scenarios and forecast
Long positions may be opened after the price consolidates above 7610.0, with a target at 7850.0. Stop-loss — 7510.0. Expected timeframe: 7 days or more.
Short positions may be opened after the price consolidates below 7480.0, with a target at 7250.0. Stop-loss — 7560.0.
Scenario
| Timeframe | Weekly |
| Recommendation | BUY STOP |
| Entry point | 7610.5 |
| Take Profit | 7850.0 |
| Stop Loss | 7510.0 |
| Key levels | 7250.0, 7480.0, 7610.0, 7850.0 |
Alternative scenario
| Recommendation | SELL STOP |
| Entry point | 7479.5 |
| Take Profit | 7250.0 |
| Stop Loss | 7560.0 |
| Key levels | 7250.0, 7480.0, 7610.0, 7850.0 |
