

Volkswagen's 2026 half-year financial report highlights pressure on earnings despite broadly stable revenue. Group revenue totalled €158.1 billion, compared with €158.4 billion a year earlier, while operating profit declined to €5.9 billion from €6.7 billion. Vehicle deliveries fell by 6.3% to approximately 4.1 million, with declines in North America and Asia-Pacific outweighing growth in Europe and South America. The operating result included around €500 million in expenses related to changes in Volkswagen's US production strategy, alongside an unfavourable sales mix. These figures provide a weaker earnings backdrop for the stock, although the report alone does not establish whether the technical support levels will hold.
On the daily chart, the stock is approaching the support line of a local descending channel bounded by 57.00 and 76.00. A break below the intermediate low near 66.00 could extend the decline.
On the four-hour chart, the potential for a reversal remains considerable, although the price is trading close to the area of its annual lows near 66.00. A sustained break below this level would bring the broader downside target of 59.00 into focus. Conversely, a sustained move above 73.00 could allow the recovery to continue. For the broader German economic backdrop, see our market review covering the latest Ifo survey.
Technical indicators maintain a steady sell signal: the Alligator indicator's faster moving averages remain below its slower lines but are gradually converging with them, while the Awesome Oscillator (AO) histogram is forming corrective bars below the zero line.
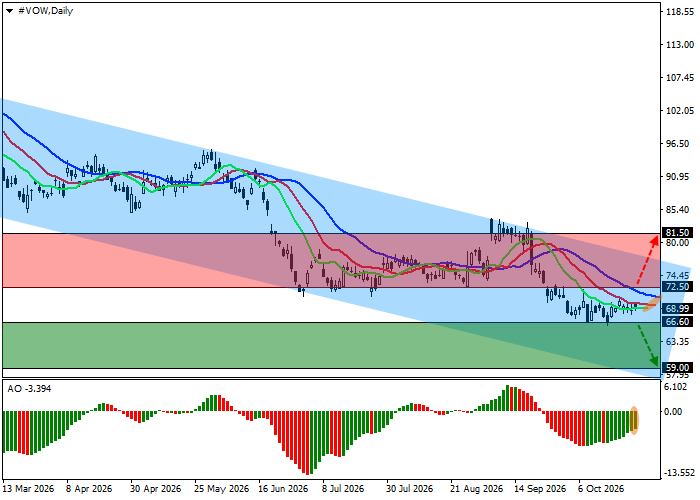
Trading Scenarios and Volkswagen AG Stock Forecast
Short positions may be considered after the price breaks and holds below 66.60, targeting 59.00. Stop Loss: 71.00. Expected holding period: 7 days or longer.
Long positions may be considered after the price breaks and holds above 72.50, targeting 81.50, with a Stop Loss at 68.00.
Primary Scenario
| Timeframe | Weekly |
| Recommendation | SELL STOP |
| Entry Point | 66.60 |
| Take Profit | 59.00 |
| Stop Loss | 71.00 |
| Key Levels | 59.00, 66.60, 72.50, 81.50 |
Alternative Scenario
| Recommendation | BUY STOP |
| Entry Point | 72.50 |
| Take Profit | 81.50 |
| Stop Loss | 68.00 |
| Key Levels | 59.00, 66.60, 72.50, 81.50 |
