

Last week, the pair approached the upper boundary of the channel near 159.00 but failed to break above it and corrected toward 156.25 (Murray level [4/8]) as the yen strengthened on growing expectations of further monetary tightening by the Bank of Japan. According to the latest data, Japan's nationwide consumer price index (CPI) accelerated from 1.9% to 2.1% year-on-year in September, while core inflation increased from 1.7% to 2.1%, moving above the regulator's 2.0% target. Meanwhile, the composite Purchasing Managers' Index (PMI) remained unchanged at 52.3 points in October. Stronger inflationary pressure amid relatively stable economic activity supports the case for another interest rate increase by the Japanese central bank. The influence of monetary policy expectations on the pair was also discussed in our previous USD/JPY forecast.
The pair has since recovered some of its losses as geopolitical tensions in the Persian Gulf have intensified, encouraging investors to turn to the US dollar as a traditional safe-haven asset. Nevertheless, the upward movement remains limited as market participants adopt a wait-and-see approach ahead of this week's key events: the Federal Reserve meeting on Wednesday and the Bank of Japan's policy decision on Friday. According to the Bank of Japan's official schedule, the Japanese regulator will hold its monetary policy meeting on October 29–30. Analysts do not expect either central bank to change interest rates this week, although officials may provide signals about their next steps, which remain uncertain. The Bank of Japan could highlight the return of inflation above its 2.0% target and warn of the risk of further price increases, potentially signalling another rate hike in December. The Federal Reserve's message could range from a cautious decision to postpone further monetary tightening while assessing economic conditions and inflation to a more hawkish outlook, including the possibility of a 50-basis-point rate increase in December if price pressures intensify.
These factors are encouraging investors to refrain from opening large positions, which could significantly limit USD/JPY price movements over the next several trading sessions.
Support and resistance levels
The trading instrument is approaching the lower Bollinger Band near 157.00. A break below 156.25 (Murray level [4/8]) could lead to a decline toward 153.12 (Murray level [2/8]) and 150.00 (Murray level [0/8]). However, if the price breaks above 159.37 (Murray level [6/8]), it could move beyond the upper boundary of the descending channel and resume growth toward 162.50 (Murray level [8/8]), 164.96 (Murray level [+1/8]) and 165.62 (Murray level [+2/8]).
Technical indicators are providing mixed signals: the Bollinger Bands are flattening, the MACD histogram has moved into negative territory but remains close to the zero line, while the Stochastic oscillator has reached oversold territory and may reverse upward.
Resistance levels: 159.37, 162.50, 164.96, 165.62.
Support levels: 156.25, 153.12, 150.00.
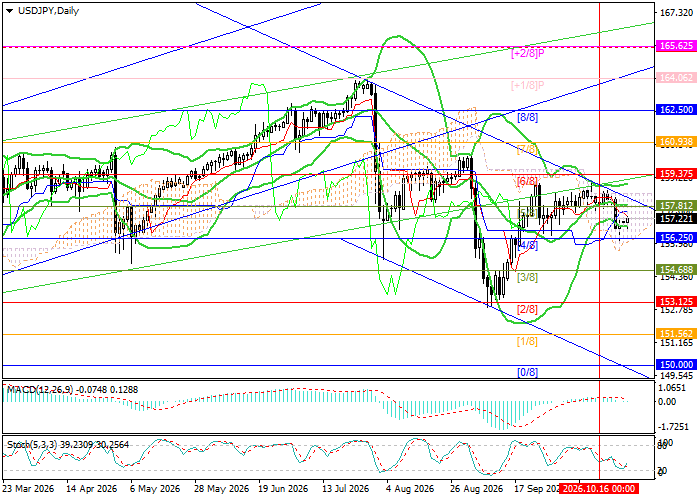
USD/JPY Trading Scenarios and Exchange Rate Forecast
Short positions may be opened below 156.25, with targets at 153.12 and 150.00 and a stop-loss at 158.00. Estimated implementation period: 5–7 days.
Long positions may be opened above 159.37, with targets at 162.50, 164.96 and 165.62 and a stop-loss at 157.50.
Scenario
| Timeframe | Weekly |
| Recommendation | SELL STOP |
| Entry Point | 156.25 |
| Take Profit | 153.12, 150.00 |
| Stop Loss | 158.00 |
| Key Levels | 150.00, 153.12, 156.25, 159.37, 162.50, 164.96, 165.62 |
Alternative Scenario
| Recommendation | BUY STOP |
| Entry Point | 159.37 |
| Take Profit | 162.50, 164.96, 165.62 |
| Stop Loss | 157.50 |
| Key Levels | 150.00, 153.12, 156.25, 159.37, 162.50, 164.96, 165.62 |
