

In the long term, the New Zealand dollar is likely to remain under pressure from high oil prices amid geopolitical tensions in the Persian Gulf, although monetary policy factors could provide some support. According to the Reserve Bank of New Zealand (RBNZ), the current interest rate stands at 2.75%, and analysts expect a possible 25-basis-point increase at the October 28 meeting. Meanwhile, the US Federal Reserve's benchmark rate remains within the 3.75–4.00% range, with no adjustment widely expected this month. As a result, the difference between the RBNZ rate and the lower bound of the Fed's target range could narrow from 1.00 to 0.75 percentage points. Westpac analysts also expect the RBNZ to continue its tightening cycle and raise the rate to 4.00% by September 2027, while the Fed may leave borrowing costs unchanged at its upcoming meeting. This divergence could help slow the decline in NZD/USD.
The US dollar, which remains a key driver of the pair's movements, is showing relatively neutral dynamics, with the US Dollar Index (USDX) trading near 101.50. Oil prices, which approached their yearly highs on Friday, have corrected, while US Treasury yields are declining across most maturities. Investors are also reluctant to open new positions ahead of the Federal Reserve's interest rate decision, scheduled for Wednesday at 20:00 (GMT+2). According to the CME FedWatch Tool, market expectations have changed only slightly, with unchanged interest rates remaining the main scenario and the probability of a hike estimated at just 9.4% in the latest market snapshot. Similar pressure on the New Zealand dollar was discussed in our previous NZD/USD forecast.
Support and resistance levels
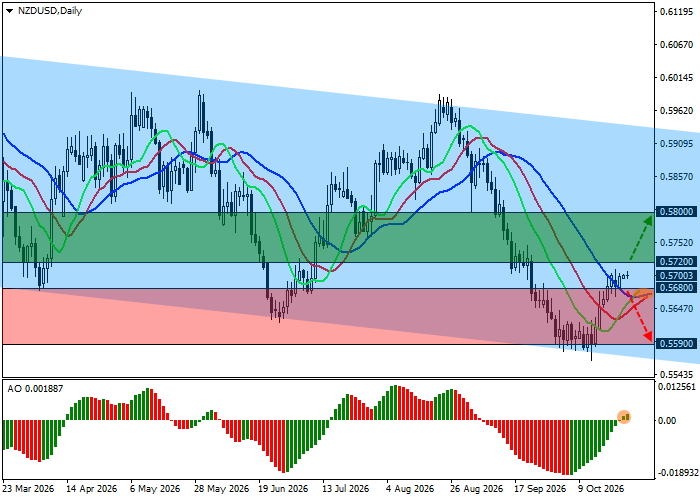
The trading instrument is moving higher, remaining significantly above the support line of a long-term descending channel with dynamic boundaries at 0.5950–0.5570.
Technical indicators maintain an unstable sell signal: the fast exponential moving averages (EMAs) of the Alligator indicator are approaching the slow ones, while the Awesome Oscillator (AO) histogram is forming rising bars in negative territory.
Support levels: 0.5680, 0.5590.
Resistance levels: 0.5720, 0.5800.
NZD/USD Trading Scenarios and Exchange Rate Forecast
Long positions may be opened after the price rises and consolidates above 0.5720, with a target at 0.5800. Stop-loss: 0.5660. Estimated implementation period: 7 days or more.
Short positions may be opened after the price declines and consolidates below 0.5680, with a target at 0.5590. Stop-loss: 0.5740.
Scenario
| Timeframe | Weekly |
| Recommendation | BUY STOP |
| Entry Point | 0.5720 |
| Take Profit | 0.5800 |
| Stop Loss | 0.5660 |
| Key Levels | 0.5590, 0.5680, 0.5720, 0.5800 |
Alternative Scenario
| Recommendation | SELL STOP |
| Entry Point | 0.5680 |
| Take Profit | 0.5590 |
| Stop Loss | 0.5740 |
| Key Levels | 0.5590, 0.5680, 0.5720, 0.5800 |
