

The third-quarter corporate earnings season continues this week, with major US companies reporting mixed results, although several have exceeded analysts' expectations. Yesterday, The Procter & Gamble Co., one of the world's largest consumer goods manufacturers, reported revenue of $23.28 billion, compared with forecasts of $22.82 billion, while core earnings per share (EPS) reached $2.00, above the expected $1.89. Railroad operator Union Pacific Corp. reported revenue of $7.20 billion against estimates of $7.14 billion, while adjusted EPS came in at $3.53 compared with forecasts of $3.47. Aerospace and defence company Lockheed Martin Corp. posted revenue of $20.70 billion and EPS of $7.97, exceeding preliminary estimates of $20.48 billion and $7.52, respectively.
The US Treasury market continues to show a downward trend in yields, with returns across most maturities retreating from multi-year highs, as also discussed in our previous Nasdaq 100 forecast. In Thursday's market snapshot, the yield on one-year Treasury securities declined from 4.500% last week to 4.400%, while the benchmark 10-year yield fell from 5.153% to 4.961%. The yield on long-term 20-year bonds decreased from 5.500% to 5.336%, and the 30-year yield retreated from 5.442% on Friday to 5.293%. The broader decline is reflected in the US Treasury's official daily yield data, although yields recovered slightly during Friday's session.
The leading gainers in the index during Thursday's session were Roper Technologies Inc. (+9.73%), Thomson Reuters Corp. (+6.94%), CSX Corp. (+6.76%), Adobe Inc. (+6.07%) and Intuit Inc. (+5.75%).
The biggest declines were recorded by Moderna Inc. (–17.57%), Lam Research Corp. (–11.76%), Lumentum Holdings Inc. (–11.54%), Astera Labs Inc. (–11.11%) and Teradyne Inc. (–10.63%).
Support and resistance levels
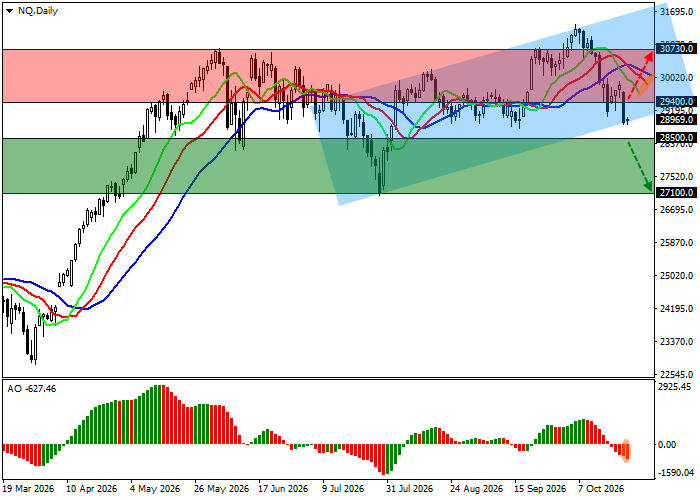
On the daily chart, the trading instrument is approaching the support line of a local ascending channel with boundaries at 31800.0–29000.0.
Technical indicators maintain an unstable sell signal: the fast exponential moving averages (EMAs) of the Alligator indicator remain below the slow ones, while the Awesome Oscillator (AO) histogram is forming corrective bars and moving further away from the zero line.
Support levels: 28500.0, 27100.0.
Resistance levels: 29400.0, 30730.0.
Nasdaq 100 Trading Scenarios and Index Forecast
Short positions may be opened after the price declines and consolidates below 28500.0, with a target at 27100.0. Stop-loss: 29200.0. Estimated implementation period: 7 days or more.
Long positions may be opened after the price rises and consolidates above 29400.0, with a target at 30730.0. Stop-loss: 29000.0.
Scenario
| Timeframe | Weekly |
| Recommendation | SELL STOP |
| Entry Point | 28500.0 |
| Take Profit | 27100.0 |
| Stop Loss | 29200.0 |
| Key Levels | 27100.0, 28500.0, 29400.0, 30730.0 |
Alternative Scenario
| Recommendation | BUY STOP |
| Entry Point | 29400.0 |
| Take Profit | 30730.0 |
| Stop Loss | 29000.0 |
| Key Levels | 27100.0, 28500.0, 29400.0, 30730.0 |
