

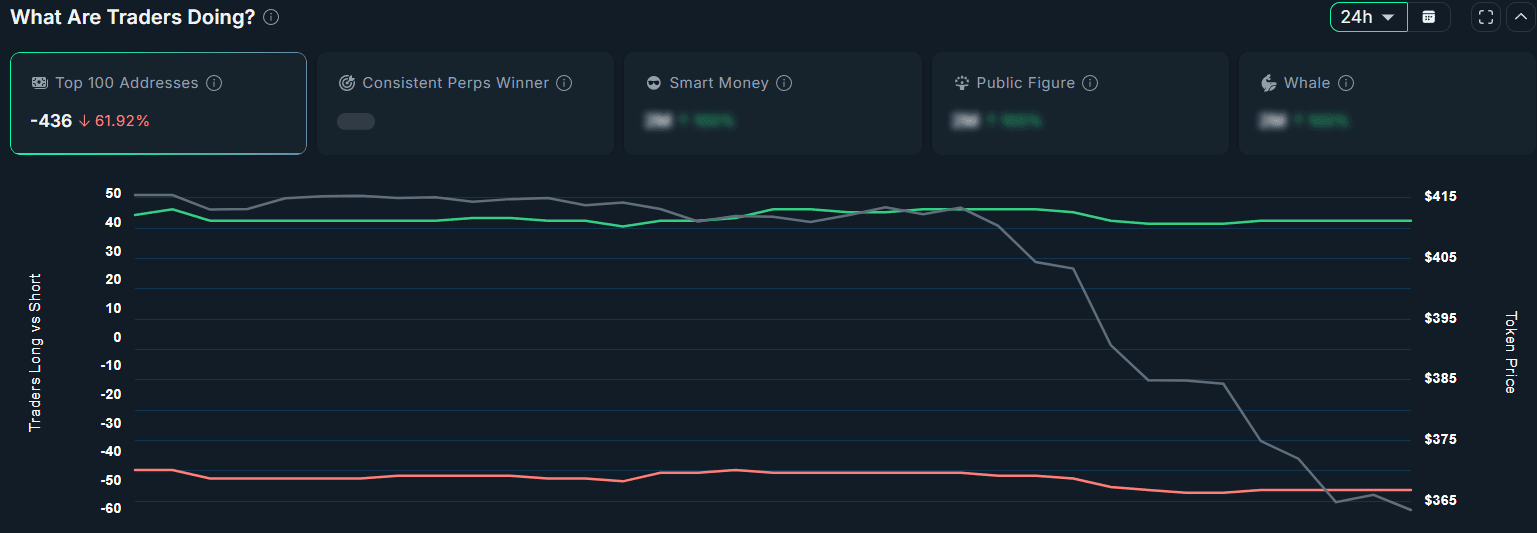
According to Nansen data, the top 100 addresses cut their BCH balances by roughly 62% within 24 hours. This move by major holders added pressure to an already fragile market. CoinGlass data also showed that nearly $985,000 worth of BCH flowed into crypto exchanges over the same period. Rising exchange inflows are often interpreted as a sign that investors may be preparing to sell.
Sentiment in the derivatives market also remains cautious. The BCH long-short ratio fell to 0.7886, showing that short positions currently dominate trading activity. In other words, more traders are positioning for further downside.
The next move in Bitcoin Cash will likely depend on whether buyers can defend the key support areas. If demand does not increase soon, selling pressure may continue to build.
What is happening to the BCH price now
Over the past 12–24 hours, Bitcoin Cash traded between $386.70 and $360.80, based on the last six 4-hour candles. The latest closing price is near $370, around $11.10 below the level recorded 24 hours earlier at $381.10.
Trading volume spiked briefly on May 19 at 12:00 UTC, coinciding with the intraday low at $360.80. BCH currently has a market capitalization of about $7.39 billion.
The price remains clearly below the EMA-20, located near $382.94. At the same time, the chart continues to show lower highs and lower lows, confirming weakness in the short-term trend.
Immediate support levels are located at $360.80 and $348.30, while resistance stands at $371.70 and $386.70. As long as BCH trades below the EMA-20, the market outlook remains neutral to bearish.
BCH remains in a consolidation phase
The Relative Strength Index is currently near 39.0, placing it below the neutral 50-point level. This suggests that buyers remain weak, although the asset has not yet reached a deeply oversold condition.
The histogram shows negative but gradually easing downside momentum. This may point to an attempt at short-term stabilization, but there is still no confirmed reversal signal.
The Bollinger Bands width is around $73.12, indicating elevated but not extreme volatility. Overall, BCH remains in a zone of uncertainty, while trading below the EMA-20 continues to limit the recovery potential.
Bitcoin Cash forecast: key scenarios
The short-term outlook for Bitcoin Cash on 20.05.2026 remains neutral to bearish. The main support levels are located at $360.80 and $348.30, while resistance levels stand at $371.70 and $386.70.
Bullish scenario
For the technical picture to improve, BCH needs to break and hold above $386.70. In that case, the price could gain a chance to recover toward the $420–455 area. A move in the RSI back above 50 points would provide additional confirmation. The probability of this scenario is currently estimated at around 20%.
Bearish scenario
If the price falls below $360.80 and then breaks through $348.30, the correction could accelerate. In this case, the next important target for sellers would be the area near $300. A drop in the RSI below 35 points would strengthen the bearish signal. The probability of this scenario is currently estimated at around 35%.
A sustained breakout above $386.70, confirmed by a move above the EMA-20 near $382.94, would ease selling pressure and open the way toward $420–455. Conversely, a move below $348.30 could strengthen downside momentum and increase the risk of a deeper correction.
