

Last week, media reports suggested that Iran was ready to abandon its nuclear program and transfer enriched uranium to third countries in exchange for access to frozen assets and security guarantees, while official Tehran allowed partial passage of vessels through the Strait of Hormuz. This sparked particular optimism among market participants and strengthened the позиции of assets seen as alternatives to the US dollar. However, over the past two days the situation changed again: the White House refused to lift the blockade on Iranian ports, and the US Navy seized the container ship Touska, which led to the renewed closure of the maritime route by the Islamic Revolutionary Guard Corps (IRGC) and Iran’s withdrawal from a new round of diplomatic consultations that had been scheduled for today in Islamabad. As the likelihood of renewed military action and rising hydrocarbon prices increased, investors turned back to the dollar as a safe-haven asset.
Additional pressure on the cryptocurrency market came from the major hack of the Kelp DAO protocol, in which attackers gained access to 116.5K rsETH (liquid restaking tokens) worth $293.0 million. The incident exposed a systemic vulnerability in the DeFi market as a whole and triggered a significant outflow of client funds from similar projects, including major platforms such as the lending protocol Aave, whose total value locked (TVL) fell over the weekend from $26.3 billion to $17.7 billion. Experts note that negative sentiment in the decentralized finance market was further intensified by the fact that the Kelp attack was not the first this month: on April 1, the Solana-based perpetuals protocol Drift was hacked for about $285.0 million, and smaller projects such as CoW Swap, Zerion, Rhea Finance, and Silo Finance were also affected afterward.
Overall, despite a number of negative signals, the correction in cryptocurrency prices remains limited for now because, according to analysts, investors had largely already priced in the geopolitical risks, and those who wanted to exit digital assets had already done so. Sentiment within the community is now gradually improving, as confirmed by the $996.5 million inflow into Ethereum ETFs last week and the return of the Fear and Greed Index to the “fear” zone at a reading of 29.
Support and resistance levels
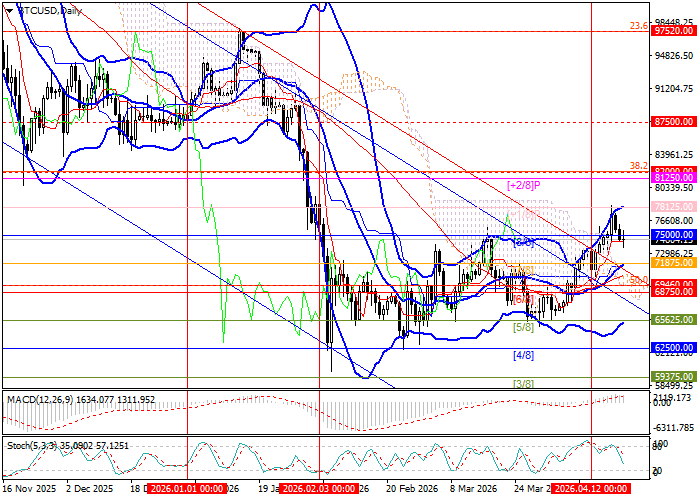
The trading instrument is attempting to form an upward trend, as confirmed by the upward reversal of the Bollinger Bands and the expansion of the MACD histogram in positive territory. If the price breaks above 78125.00 (Murray level [+1/8]), further growth is expected toward 82000.00 (38.2% Fibonacci correction) and 87500.00 (Murray level [3/8], W1). However, if the middle Bollinger Band at 71875.00 (Murray level [5/8]) is broken to the downside, the decline may resume toward 65625.00 (Murray level [5/8]) and 62500.00 (Murray level [4/8]).
Resistance levels: 78125.00, 82000.00, 87500.00.
Support levels: 71875.00, 65625.00, 62500.00.
Trading scenarios and BTC/USD forecast
Long positions may be opened above 78125.00 with targets at 82000.00 and 87500.00, and a stop-loss at 75600.00. Timeframe for implementation: 5–7 days.
Short positions may be opened below 71875.00 with targets at 65625.00 and 62500.00, and a stop-loss at 76300.00.
Scenario
| Timeframe | Weekly |
| Recommendation | BUY STOP |
| Entry Point | 78200.00 |
| Take Profit | 82000.00, 87500.00 |
| Stop Loss | 75600.00 |
| Key Levels | 62500.00, 65625.00, 71875.00, 78125.00, 82000.00, 87500.00 |
Alternative Scenario
| Recommendation | SELL STOP |
| Entry Point | 71820.00 |
| Take Profit | 65625.00, 62500.00 |
| Stop Loss | 76300.00 |
| Key Levels | 62500.00, 65625.00, 71875.00, 78125.00, 82000.00, 87500.00 |
