

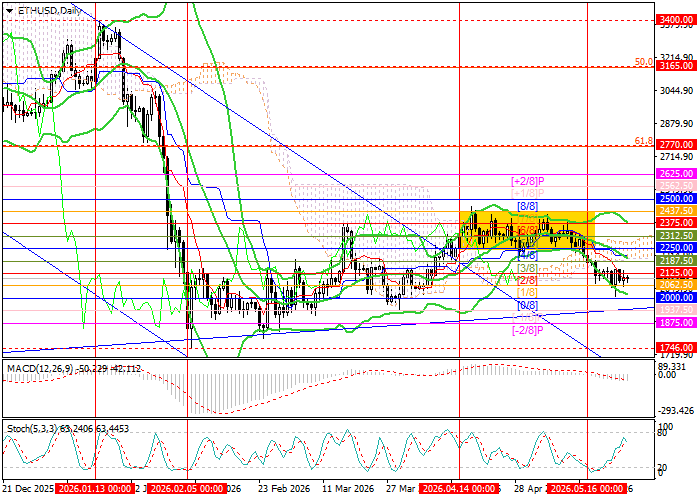
Technical indicators allow for a continuation of the downward movement: Bollinger Bands are directed downward, as on the weekly chart, while cryptocurrency quotes have still failed to break through the central line, which points to bearish potential. At the same time, the MACD histogram remains stable in the negative zone, while Stochastic is attempting to reverse from the overbought area.
Support and resistance levels
Resistance levels: 2250.00, 2437.50, 2625.00, 2770.00.
Support levels: 2000.00, 1875.00, 1746.00.
ETH/USD trading scenarios and forecast
Short positions may be opened below 2000.00, with targets at 1875.00 and 1746.00 and a stop-loss at 2100.00. Expected timeframe: 5−7 days.
Long positions may be opened above 2250.00, with targets at 2437.50, 2625.00, and 2770.00 and a stop-loss at 2150.00.
Scenario
| Timeframe | Weekly |
| Recommendation | SELL STOP |
| Entry point | 1997.00 |
| Take Profit | 1875.00, 1746.00 |
| Stop Loss | 2100.00 |
| Key levels | 1746.00, 1875.00, 2000.00, 2250.00, 2437.50, 2625.00, 2770.00 |
Alternative scenario
| Recommendation | BUY STOP |
| Entry point | 2255.00 |
| Take Profit | 2437.50, 2625.00, 2770.00 |
| Stop Loss | 2150.00 |
| Key levels | 1746.00, 1875.00, 2000.00, 2250.00, 2437.50, 2625.00, 2770.00 |
Conclusion:
Ethereum still shows bearish potential after breaking below the lower boundary of its sideways range. The key level remains 2000.00: a breakout below it could deepen the decline and push the price out of the long-term ascending channel.
