

The cryptocurrency market is under pressure amid a renewed escalation of geopolitical tensions in the Middle East: earlier, the Islamic Revolutionary Guard Corps (IRGC) attacked three merchant vessels passing through the Strait of Hormuz, after which the sides exchanged missile strikes, with the United States hitting Iranian infrastructure on the Persian Gulf coast and Iran targeting opposing bases in Kuwait and Bahrain. Investors fear that the escalation of the conflict will lead to renewed growth in oil prices, which had recently returned to pre-crisis levels, and trigger an acceleration of global inflation. This, in turn, would increase the likelihood of tighter monetary policy from the US Federal Reserve. As a result, investor interest in risk assets has declined significantly, while the US dollar has strengthened as a traditional safe haven.
Thus, the potential for further negative dynamics remains, although it is being restrained by hopes for the successful launch of the Ethereum Glamsterdam upgrade. The blockchain modernization is currently in the testing phase and is expected to increase data-processing speed in the network in the future by enabling parallel processing of a larger number of transactions. Meanwhile, BitMine Immersion Technologies Inc. continues to accumulate ETH, increasing its holdings by another 325.0 thousand tokens over the past month to 5.74 million. As a result, the company is confidently moving toward its goal of acquiring 5.0% of the token’s total supply.
Overall sentiment in the cryptocurrency sector remains negative: the balance of Ethereum ETFs has increased by $91.4 million since the beginning of the month, but it may begin to decline in the near future once institutional players react to the worsening geopolitical tensions. The Fear & Greed Index remains in the “extreme fear” zone at 20.
Support and Resistance Levels
The trading instrument is attempting to resume its decline from the upper boundary of the descending channel: if the price breaks below the middle line of the Bollinger Bands at 1680.00, negative dynamics may develop toward the targets of 1500.00 (Murray level [0/8]) and 1250.00 (Murray level [–2/8]). However, if the price overcomes 1875.00 (Murray level [3/8]), a medium-term recovery toward 2250.00 (Murray level [6/8]) and 2500.00 (Murray level [8/8]) is expected.
Technical indicators do not provide a single clear signal: the Bollinger Bands are moving horizontally, the MACD histogram is preparing to move into positive territory, while the Stochastic oscillator is turning downward from the overbought zone. On the weekly chart, the Bollinger Bands are still pointing downward, confirming that the long-term downtrend remains in place.
Resistance levels: 1875.00, 2250.00, 2500.00.
Support levels: 1680.00, 1500.00, 1250.00.
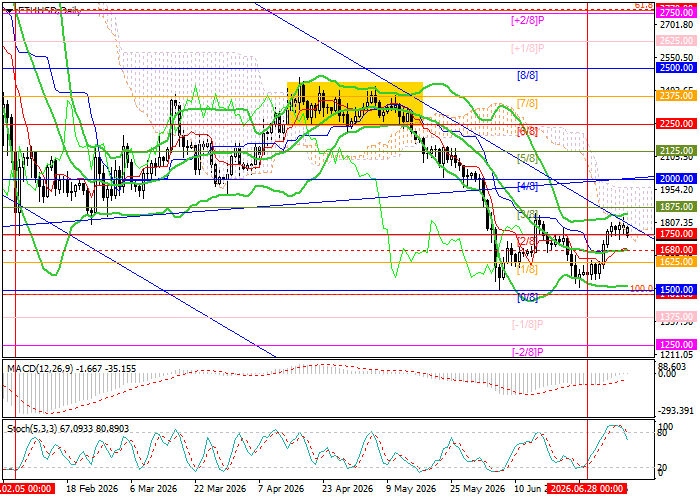
Trading Scenarios and ETH/USD Price Forecast
Short positions can be opened below 1680.00 with targets at 1500.00, 1250.00 and a stop-loss at 1790.00. Estimated implementation period: 5–7 days.
Long positions can be opened above 1875.00 with targets at 2250.00, 2500.00 and a stop-loss at 1730.00.
Scenario
| Timeframe | Weekly |
| Recommendation | SELL STOP |
| Entry Point | 1679.95 |
| Take Profit | 1500.00, 1250.00 |
| Stop Loss | 1790.00 |
| Key Levels | 1250.00, 1500.00, 1680.00, 1875.00, 2250.00, 2500.00 |
Alternative Scenario
| Recommendation | BUY STOP |
| Entry Point | 1875.05 |
| Take Profit | 2250.00, 2500.00 |
| Stop Loss | 1730.00 |
| Key Levels | 1250.00, 1500.00, 1680.00, 1875.00, 2250.00, 2500.00 |
