

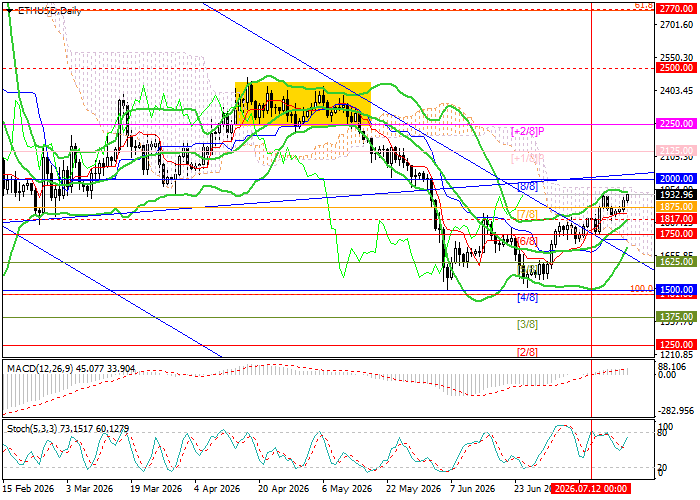
Technical indicators point to strengthening bullish momentum: the Bollinger Bands are turning upwards, while the MACD histogram is increasing in the positive zone. However, the Stochastic Oscillator is approaching the overbought area, suggesting that a correction remains possible, although its potential is currently limited. It is also worth noting that on the weekly chart, the Bollinger Bands are beginning to flatten after a period of decline, while a bullish divergence is forming between the price chart and the MACD histogram. This may indicate an upcoming reversal of the long-term downtrend and confirms the relevance of the bullish scenario.
Support and resistance levels
Resistance levels: 2000.00, 2250.00, 2500.00.
Support levels: 1750.00, 1500.00, 1250.00.
ETH/USD trading scenarios and forecast
Long positions may be opened above 2000.00 with targets at 2250.00 and 2500.00 and a stop loss at 1815.00. Estimated time frame: 5–7 days.
Short positions may be opened below 1750.00 with targets at 1500.00 and 1250.00 and a stop loss at 1930.00.
Main scenario
| Time frame | Weekly |
| Recommendation | BUY STOP |
| Entry point | 2005.00 |
| Take Profit | 2250.00, 2500.00 |
| Stop Loss | 1815.00 |
| Key levels | 1250.00, 1500.00, 1750.00, 2000.00, 2250.00, 2500.00 |
Alternative scenario
| Recommendation | SELL STOP |
| Entry point | 1740.00 |
| Take Profit | 1500.00, 1250.00 |
| Stop Loss | 1930.00 |
| Key levels | 1250.00, 1500.00, 1750.00, 2000.00, 2250.00, 2500.00 |
