

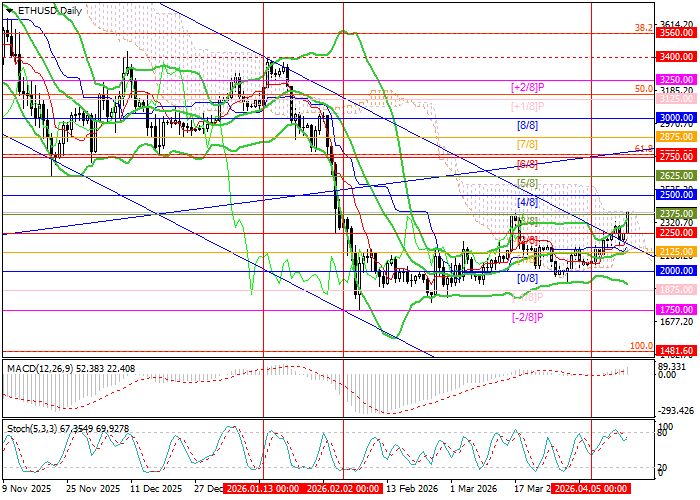
Technical indicators still allow for further growth: Bollinger Bands are turning upward, the MACD histogram is increasing in the positive zone, and Stochastic has left the overbought area, which does not rule out a correction, although its potential still appears limited. It should also be noted that on the weekly chart Bollinger Bands remain directed downward, confirming that the long-term bearish trend is still intact. Under these conditions, the current price movement still shows signs of a flag pattern forming, while at the same time suggesting a possible reversal from the 2500.00 level.
Support and resistance levels
Resistance levels: 2500.00, 2812.50, 3125.00, 3400.00.
Support levels: 2000.00, 1750.00, 1481.50.
Trading scenarios and ETH/USD forecast
Long positions may be opened above 2500.00 with targets at 2812.50, 3125.00, and 3400.00, with a stop-loss at 2315.00. Implementation period: 5–7 days.
Short positions may be considered below 2000.00 with targets at 1750.00 and 1481.50, with a stop-loss at 2180.00.
Scenario
| Timeframe | Weekly |
| Recommendation | BUY STOP |
| Entry Point | 2410.00 |
| Take Profit | 2812.50, 3125.00, 3400.00 |
| Stop Loss | 2315.00 |
| Key Levels | 1481.50, 1750.00, 2000.00, 2500.00, 2812.50, 3125.00, 3400.00 |
Alternative Scenario
| Recommendation | SELL STOP |
| Entry Point | 1985.00 |
| Take Profit | 1750.00, 1481.50 |
| Stop Loss | 2180.00 |
| Key Levels | 1481.50, 1750.00, 2000.00, 2500.00, 2812.50, 3125.00, 3400.00 |
