

Technical indicators do not provide a clear signal: Bollinger Bands are flattening within the sideways range, the MACD histogram is preparing to enter negative territory, while the Stochastic Oscillator may turn upward from oversold levels. In addition, the weekly chart still reflects a medium-term downtrend, making further bearish movement the most likely scenario.
Support and Resistance Levels
Resistance levels: 137.50, 150.00, 162.50.
Support levels: 125.00, 107.40, 100.00. 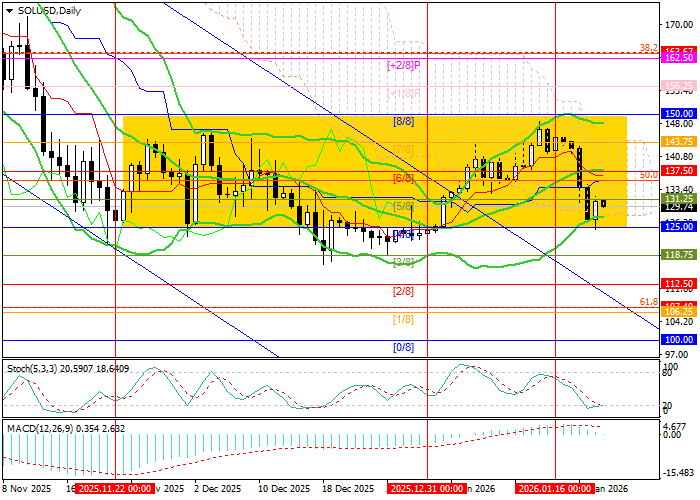
Trading Scenarios and SOL/USD Price Forecast
Short positions can be opened below the 125.00 level with targets at 107.40 and 100.00, and a stop-loss at 136.00. Time horizon: 5–7 days.
Long positions can be opened above the 137.50 level with targets at 150.00 and 162.50, and a stop-loss at 127.50.
Scenario
| Timeframe | Weekly |
| Recommendation | SELL STOP |
| Entry point | 124.10 |
| Take Profit | 107.40, 100.00 |
| Stop Loss | 136.00 |
| Key levels | 100.00, 107.40, 125.00, 137.50, 150.00, 162.50 |
Alternative Scenario
| Recommendation | BUY STOP |
| Entry point | 138.50 |
| Take Profit | 150.00, 162.50 |
| Stop Loss | 127.50 |
| Key levels | 100.00, 107.40, 125.00, 137.50, 150.00, 162.50 |
SOL/USD remains under sustained bearish pressure, with price action confined to a narrow consolidation zone that increases the probability of a downside breakout. A confirmed move below 125 would likely accelerate selling toward 107 and 100, while bullish recovery requires a firm breakout above 137.5.
