

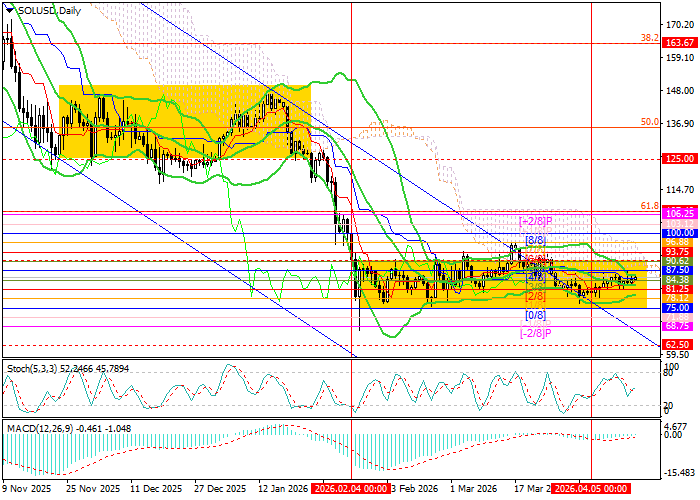
Technical indicators are not giving a unified signal, although this does not rule out further sideways trading: Bollinger Bands are flat, the MACD histogram is hovering near the zero line with low volume, and Stochastic is attempting an upward reversal. It is also worth noting that on the weekly chart, Bollinger Bands are still pointing downward, confirming that the long-term bearish trend remains in place, while there are also signs of a new flag pattern forming.
Support and resistance levels
Resistance levels: 91.00, 100.00, 107.40, 125.00.
Support levels: 75.00, 68.75, 62.50.
Trading scenarios and SOL/USD forecast
Short positions may be considered below 75.00 with targets at 68.75 and 62.50, with a stop-loss at 80.00. Implementation period: 5–7 days.
Long positions may be considered above 91.00 with targets at 100.00, 107.40, and 125.00, with a stop-loss at 84.50.
Scenario
| Timeframe | Weekly |
| Recommendation | SELL STOP |
| Entry Point | 74.80 |
| Take Profit | 68.75, 62.50 |
| Stop Loss | 80.00 |
| Key Levels | 62.50, 68.75, 75.00, 91.00, 100.00, 107.40, 125.00 |
Alternative Scenario
| Recommendation | BUY STOP |
| Entry Point | 91.30 |
| Take Profit | 100.00, 107.40, 125.00 |
| Stop Loss | 84.50 |
| Key Levels | 62.50, 68.75, 75.00, 91.00, 100.00, 107.40, 125.00 |
