

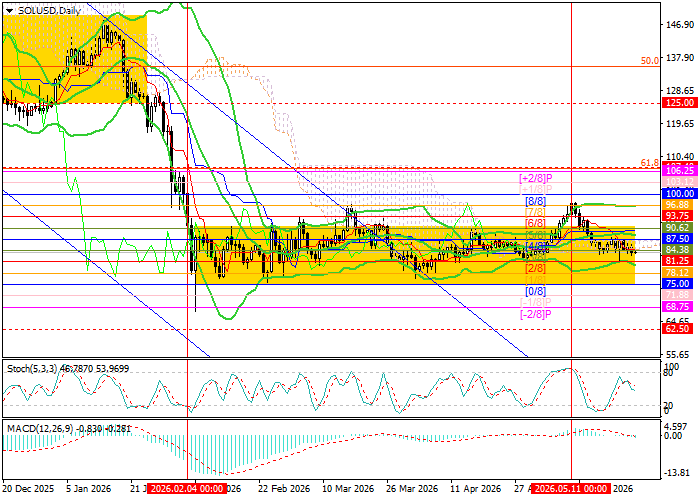
Technical indicators do not provide a single clear signal, reflecting the current uncertainty in the market: Bollinger Bands have shifted to horizontal movement, the MACD histogram has moved into the negative zone, and Stochastic has turned downward. It is also worth noting that on the weekly chart, Bollinger Bands are still directed downward, confirming the preservation of the long-term downtrend. However, a trend change cannot be ruled out, as quotes are preparing to test the middle line of the Bollinger Bands at 93.75, the Murray level [3/8] on W1.
Support and resistance levels
Resistance levels: 90.62, 100.00, 107.40, 125.00. Support levels: 75.00, 68.75, 62.50.
SOL/USD trading scenarios and forecast
Short positions may be opened from the 83.00 level, with targets at 75.00, 68.75, and 62.50 and a stop-loss at 87.50. Expected timeframe: 5–7 days. Long positions may be opened above 90.62, with targets at 100.00, 107.40, and 125.00 and a stop-loss at 86.60.
Scenario
| Timeframe | Weekly |
| Recommendation | SELL STOP |
| Entry point | 83.00 |
| Take Profit | 75.00, 68.75, 62.50 |
| Stop Loss | 87.50 |
| Key levels | 62.50, 68.75, 75.00, 90.62, 100.00, 107.40, 125.00 |
Alternative scenario
| Recommendation | BUY STOP |
| Entry point | 90.65 |
| Take Profit | 100.00, 107.40, 125.00 |
| Stop Loss | 86.60 |
| Key levels | 62.50, 68.75, 75.00, 90.62, 100.00, 107.40, 125.00 |
Conclusion:
The dollar remains supported by safe-haven demand as Middle East tensions rise again and markets prepare for key U.S. inflation data. If core PCE confirms stronger price pressure, expectations of tighter Fed policy could further strengthen the U.S. currency.
