

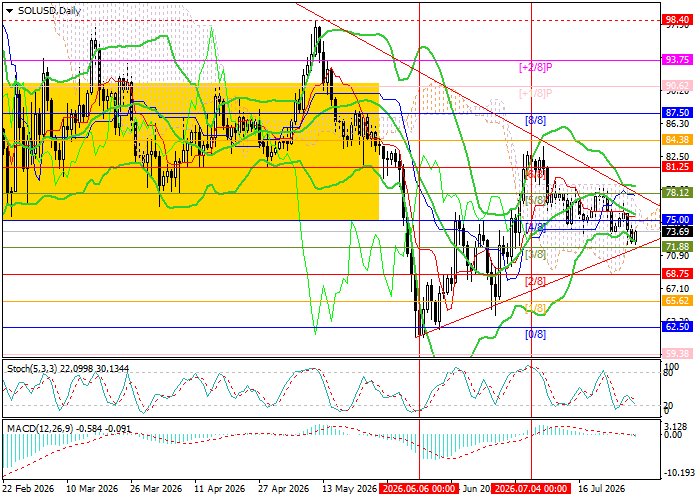
Technical indicators suggest that the current downward trend may continue. The Bollinger Bands and Stochastic Oscillator are turning lower, while the MACD histogram has moved into negative territory. On the weekly chart, the Bollinger Bands and Stochastic Oscillator are also pointing downward, confirming the potential for further bearish pressure.
Support and Resistance Levels
Resistance levels: 78.12, 87.50, 93.75.
Support levels: 71.88, 65.62, 62.50.
SOL/USD Trading Scenarios and Price Forecast
Short positions may be opened below 71.88 with targets at 65.62 and 62.50 and a stop-loss at 76.20. Estimated time frame: 5–7 days.
Long positions may be opened above 78.12 with targets at 87.50 and 93.75 and a stop-loss at 74.70.
Main Scenario
| Time Frame | Weekly |
| Recommendation | SELL STOP |
| Entry Point | 71.40 |
| Take Profit | 65.62, 62.50 |
| Stop Loss | 76.20 |
| Key Levels | 62.50, 65.62, 71.88, 78.12, 87.50, 93.75 |
Alternative Scenario
| Recommendation | BUY STOP |
| Entry Point | 78.50 |
| Take Profit | 87.50, 93.75 |
| Stop Loss | 74.70 |
| Key Levels | 62.50, 65.62, 71.88, 78.12, 87.50, 93.75 |
Conclusion: SOL/USD remains under bearish pressure, with momentum indicators supporting a possible breakdown below $71.88. A sustained move above $78.12 would invalidate the downside scenario and shift momentum back in favour of buyers.
