

Despite politicians’ statements about the continuation of the U.S.–Iran negotiation process, the parties are close to a new round of full-scale military confrontation. Today, Tehran attacked Israel, stating that the bombardments would be repeated if hostilities in Lebanon do not stop. Escalation of the conflict could lead to further destruction of Middle Eastern oil production infrastructure, a deepening energy crisis, and increased pressure on the global economy.
Meanwhile, in the United States, the consumer price index rose in April from 3.3% to a three-year high of 3.8%, the producer price index increased from 4.3% to 6.0%, and the personal consumption expenditures indicator reached 3.8%. At the same time, the labor market remains stable: in May, unemployment stayed at 4.3%, while employment increased by 172.0K, significantly exceeding the forecast of 85.0K. This strengthens investor confidence in a possible interest rate increase as early as December.
Against this background, sentiment in the cryptocurrency market has deteriorated sharply: the Fear and Greed Index returned to the “extreme fear” zone and reached a three-month low near 12. Outflows from digital exchange-traded funds have been accelerating for four consecutive weeks, amounting to 1.00 billion dollars from May 11 to 15, 1.26 billion dollars from May 18 to 22, 1.42 billion dollars from May 25 to 29, and 1.72 billion dollars from June 1 to 5. The acceleration of withdrawals from Bitcoin ETFs is forcing analysts to worry that institutional investors have changed their attitude toward the world’s leading cryptocurrency and no longer view it as a reliable asset for portfolio diversification. It should be noted that the price has now managed to recover a small part of its losses after Strategy hinted at resuming purchases following last week’s sale of 32 BTC. However, overall, the prerequisites for a further decline in BTC/USD in the near term remain in place.
Support and resistance levels
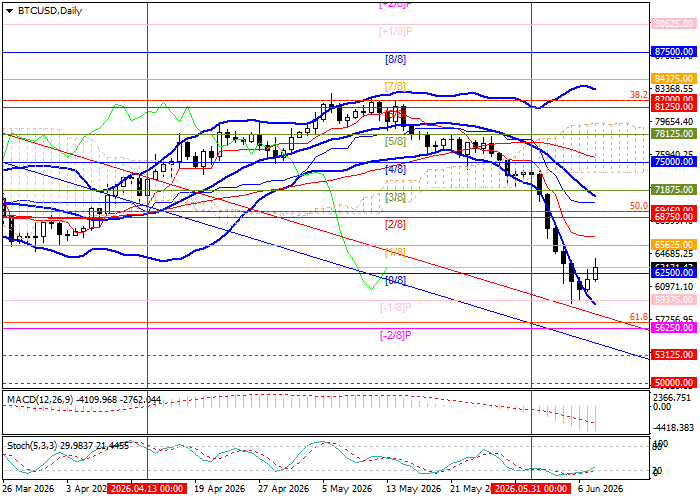
The trading instrument is forming a downtrend near 59375.00, the Murray level [–1/8]. A downward breakout of this level would allow the price to reach 53125.00, the Murray level [1/8] on H4, and 50000.00, the Murray level [0/8] on H4. However, if the price breaks above the middle line of the Bollinger Bands at 68750.00, the Murray level [2/8] and the 50.0% Fibonacci retracement, growth toward 75000.00, the Murray level [4/8], 82000.00, the 38.2% Fibonacci retracement, and 87500.00, the Murray level [8/8], is expected.
Technical indicators maintain a sell signal: Bollinger Bands are turning downward, the MACD histogram is increasing in the negative zone, while Stochastic is leaving the oversold area, which does not exclude a limited rebound.
Resistance levels: 68750.00, 75000.00, 82000.00, 87500.00.
Support levels: 59375.00, 53125.00, 50000.00.
BTC/USD trading scenarios and forecast
Short positions may be opened below 59375.00, with targets at 53125.00 and 50000.00 and a stop-loss at 64200.00. Expected timeframe: 5–7 days.
Long positions may be opened above 68750.00, with targets at 75000.00, 82000.00, and 87500.00 and a stop-loss at 65500.00.
Scenario
| Timeframe | Weekly |
| Recommendation | SELL STOP |
| Entry point | 59374.95 |
| Take Profit | 53125.00, 50000.00 |
| Stop Loss | 64200.00 |
| Key levels | 50000.00, 53125.00, 59375.00, 68750.00, 75000.00, 82000.00, 87500.00 |
Alternative scenario
| Recommendation | BUY STOP |
| Entry point | 68750.05 |
| Take Profit | 75000.00, 82000.00, 87500.00 |
| Stop Loss | 65500.00 |
| Key levels | 50000.00, 53125.00, 59375.00, 68750.00, 75000.00, 82000.00, 87500.00 |
