

Technical indicators provide mixed signals, highlighting continued market uncertainty. Bollinger Bands have shifted to horizontal movement, the MACD histogram remains near the zero line with low volumes, and the Stochastic oscillator is turning downward from overbought territory. On the weekly chart, Bollinger Bands still point downward while the MACD histogram expands in negative territory, with signs of a developing flag pattern.
Support and Resistance Levels
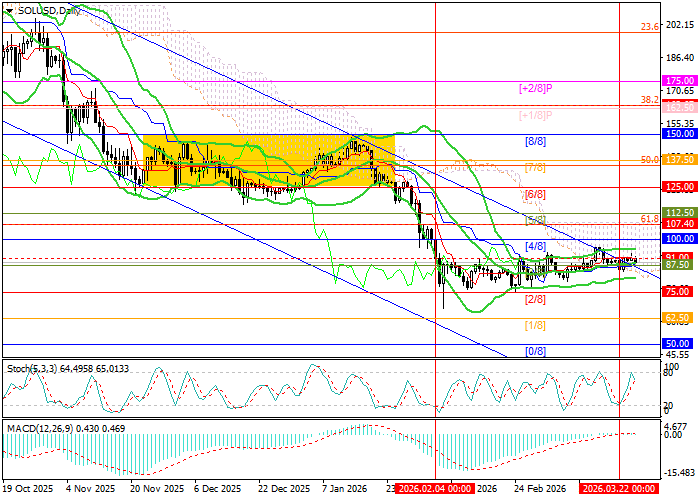
Resistance levels: 100.00, 125.00, 137.50.
Support levels: 75.00, 62.50, 50.00.
Trading Scenarios and SOL/USD Forecast
Short positions can be opened below 75.00 with targets at 62.50 and 50.00 and a stop-loss at 84.50. Implementation period: 5–7 days.
Long positions can be opened above 100.00 with targets at 125.00 and 137.50 and a stop-loss at 91.00.
Scenario
| Timeframe | Weekly |
| Recommendation | SELL STOP |
| Entry Point | 74.70 |
| Take Profit | 62.50, 50.00 |
| Stop Loss | 84.50 |
| Key Levels | 50.00, 62.50, 75.00, 100.00, 125.00, 137.50 |
Alternative Scenario
| Recommendation | BUY STOP |
| Entry Point | 100.60 |
| Take Profit | 125.00, 137.50 |
| Stop Loss | 91.00 |
| Key Levels | 50.00, 62.50, 75.00, 100.00, 125.00, 137.50 |
