

Overall, the cryptocurrency market remains influenced by a number of opposing factors. Pressure on the sector comes from the continuation of military tensions between the United States and Iran, increasing risks of global inflation and economic slowdown. As a result, investors are shifting toward traditional safe-haven assets, particularly precious metals. At the same time, recent developments have partially restored risk appetite among market participants. US President Donald Trump recently hinted at the possibility of winding down the operation, stating that many of its objectives had already been achieved.
Meanwhile, according to The Wall Street Journal, the International Energy Agency (IEA) is considering releasing record oil reserves exceeding the 182.0 million barrels that were deployed in 2022 following the start of the Russia-Ukraine conflict. The proposal is currently under discussion and, if approved by all 32 IEA member states, could be implemented in the near future. Such a move may significantly slow the rise in energy prices and reduce the risk of accelerating consumer inflation.
Monetary factors are also preventing a deeper decline in cryptocurrency prices. Previously, most analysts expected the US Federal Reserve to keep interest rates elevated for an extended period due to inflation risks. However, after the publication of unexpectedly weak February labor market data in the United States — where unemployment rose from 4.3% to 4.4% and employment declined by 92.0K instead of the expected increase of 58.0K — the probability of monetary easing in the medium term has increased again, putting pressure on the US dollar.
Overall, market conditions remain relatively calm. The Crypto Fear and Greed Index has risen to 15 but still remains within the “Extreme Fear” zone. Over the last four sessions, Ripple ETF products recorded capital outflows totaling $32.5 million, although the long-term trend remains positive. Bloomberg research notes that XRP-based exchange-traded products are particularly popular among retail investors, while institutional investors tend to prefer other crypto investment vehicles. This is reflected in the fact that only about 16% of Ripple ETF holders file the mandatory 13F reporting form required for large institutional investors.
Support and resistance levels
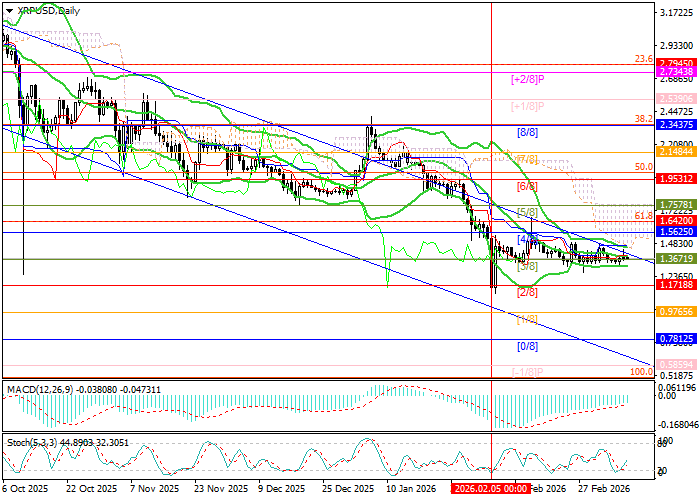
The instrument continues to trade within the 1.5625–1.3671 range (Murray levels [4/8]–[3/8]). If prices consolidate below the lower boundary, the next targets may be 0.9765 (Murray level [1/8]) and 0.7812 (Murray level [0/8]). On the other hand, a breakout above the upper boundary could trigger renewed growth toward 1.9531 (Murray level [6/8]) and 2.3437 (Murray level [8/8], Fibonacci retracement 38.2%).
Technical indicators do not provide a unified signal, reflecting the current uncertainty in the market. Bollinger Bands have turned horizontal, the MACD histogram remains stable in negative territory, and Stochastic is turning upward from the oversold zone. In addition, Bollinger Bands on the weekly chart are directed downward, confirming the persistence of the long-term bearish trend and supporting the possibility of further downside movement after the formation of a “flag” pattern.
Resistance levels: 1.5625, 1.9531, 2.3437.
Support levels: 1.3671, 0.9765, 0.7812.
Trading scenarios and XRP/USD forecast
Short positions may be opened below the 1.3671 level with targets at 0.9765 and 0.7812 and a stop-loss at 1.5600. Implementation period: 5–7 days.
Long positions may be opened above the 1.5625 level with targets at 1.9531 and 2.3437 and a stop-loss at 1.3700.
Scenario
| Timeframe | Weekly |
| Recommendation | SELL STOP |
| Entry Point | 1.3250 |
| Take Profit | 0.9765, 0.7812 |
| Stop Loss | 1.5600 |
| Key levels | 0.7812, 0.9765, 1.3671, 1.5625, 1.9531, 2.3437 |
Alternative scenario
| Recommendation | BUY STOP |
| Entry Point | 1.5650 |
| Take Profit | 1.9531, 2.3437 |
| Stop Loss | 1.3700 |
| Key levels | 0.7812, 0.9765, 1.3671, 1.5625, 1.9531, 2.3437 |
