

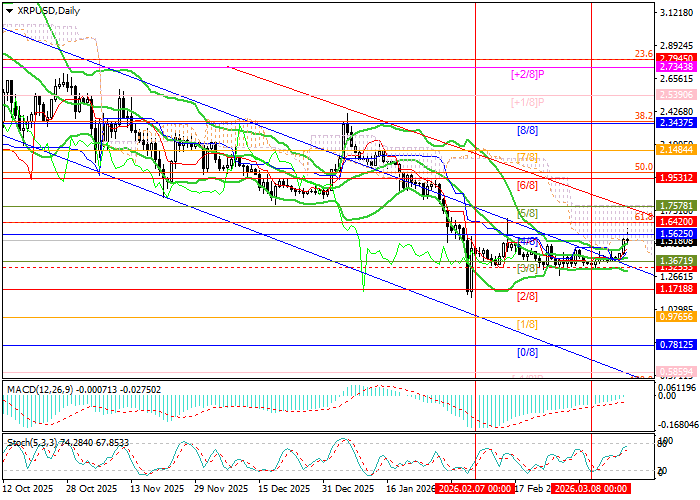
For bearish scenarios, the key level remains the lower boundary of the range at 1.3671 (Murray level [3/8]). A breakdown below this level could trigger further downside toward 0.9765 (Murray level [1/8]) and 0.7812 (Murray level [0/8]).
Technical indicators provide mixed signals. Bollinger Bands are turning upward, the MACD histogram is approaching the positive zone, and the Stochastic oscillator is moving toward overbought territory and may soon reverse. At the same time, on the weekly chart, Bollinger Bands are trending downward, confirming that the broader long-term trend remains bearish. A “flag” pattern is forming, but a corrective move toward 1.9531 (the middle Bollinger Band on W1) cannot be ruled out.
Support and resistance levels
Resistance levels: 1.5625, 1.6420, 1.9531, 2.3437.
Support levels: 1.3671, 0.9765, 0.7812.
Trading scenarios and XRP forecast
Long positions may be considered above 1.6420 with targets at 1.9531 and 2.3437. Stop-loss: 1.4200. Timeframe: 5–7 days.
Short positions may be considered below 1.3671 with targets at 0.9765 and 0.7812. Stop-loss: 1.5630.
Scenario
| Timeframe | Weekly |
| Recommendation | BUY STOP |
| Entry point | 1.6440 |
| Take Profit | 1.9531, 2.3437 |
| Stop Loss | 1.4200 |
| Key levels | 0.7812, 0.9765, 1.3671, 1.5625, 1.6420, 1.9531, 2.3437 |
Alternative scenario
| Recommendation | SELL STOP |
| Entry point | 1.3650 |
| Take Profit | 0.9765, 0.7812 |
| Stop Loss | 1.5630 |
| Key levels | 0.7812, 0.9765, 1.3671, 1.5625, 1.6420, 1.9531, 2.3437 |
