

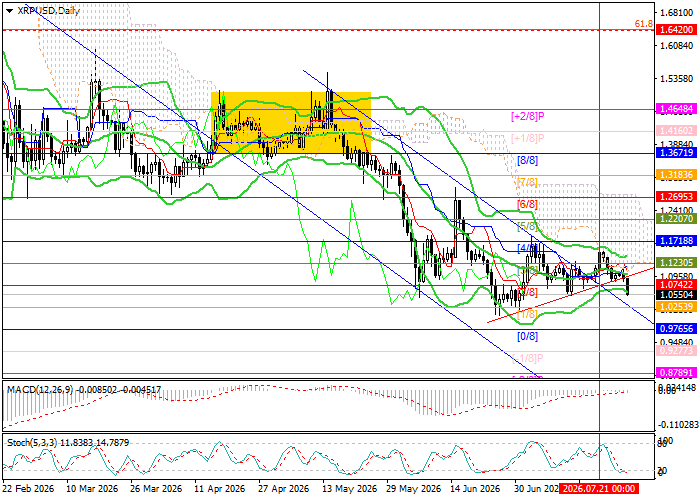
Technical indicators do not provide a unified signal. The Bollinger Bands have shifted into a horizontal direction, while the MACD histogram is preparing to move into negative territory. However, the Stochastic oscillator has reached the oversold zone and is preparing to reverse. It is also worth noting that the Bollinger Bands on the weekly chart remain directed downward, confirming the continuation of the long-term bearish trend. The price chart also resembles a developing flag pattern, indicating considerable bearish potential.
Support and Resistance Levels
Resistance levels: 1.1718, 1.2695, 1.3671, 1.4648.
Support levels: 1.0253, 0.9277, 0.8789.
XRP/USD Trading Scenarios and Price Forecast
Short positions may be opened below 1.0253 with targets at 0.9277 and 0.8789 and a stop-loss at 1.1000. Estimated implementation period: 5–7 days.
Long positions may be opened above 1.1718 with targets at 1.2695, 1.3671 and 1.4648 and a stop-loss at 1.1000.
Main Scenario
| Timeframe | Weekly |
| Recommendation | SELL STOP |
| Entry Point | 1.0250 |
| Take Profit | 0.9277, 0.8789 |
| Stop Loss | 1.1000 |
| Key Levels | 0.8789, 0.9277, 1.0253, 1.1718, 1.2695, 1.3671, 1.4648 |
Alternative Scenario
| Recommendation | BUY STOP |
| Entry Point | 1.1720 |
| Take Profit | 1.2695, 1.3671, 1.4648 |
| Stop Loss | 1.1000 |
| Key Levels | 0.8789, 0.9277, 1.0253, 1.1718, 1.2695, 1.3671, 1.4648 |