

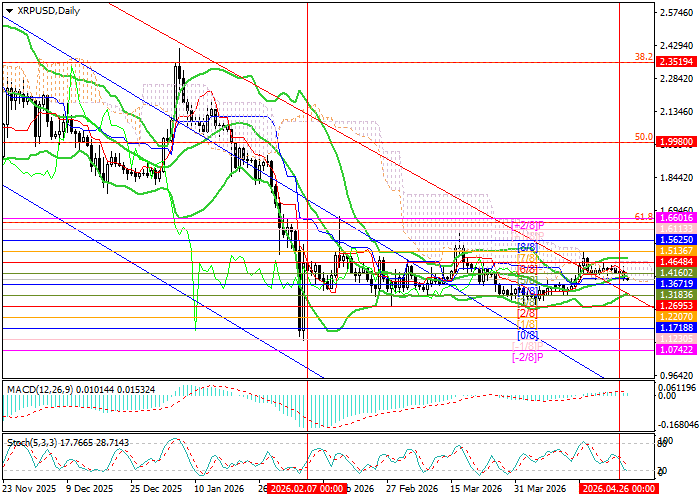
Against the backdrop of the uncertain geopolitical situation in the Middle East and the difficulty of forecasting the next steps of central banks in monetary policy, investors are still in no hurry to open new positions, preventing the price from determining the direction of its next move. The 1.5625 mark (Murray level [8/8]) appears to be key for the bulls, as it coincides with the middle line of the Bollinger Bands (W1): consolidation above it would allow the instrument to finally leave the descending channel and change the current trend, followed by a test of the targets at 1.9980 (50.0% Fibonacci correction) and 2.3519 (38.2% Fibonacci correction). If the level of 1.3671 (Murray level [4/8]) is broken, the decline may intensify toward the lower boundary of the range at 1.2695 (Murray level [2/8]) and then toward 1.0742 (Murray level [–2/8]) and 0.7812 (Murray level [2/8], W1).
Technical indicators do not provide a unified signal: the Bollinger Bands are moving horizontally, the MACD histogram is stable in the positive zone, while the Stochastic is heading downward. It is also worth noting that on the weekly chart, the Bollinger Bands are still directed downward, and the MACD histogram remains stable in the negative zone, confirming that the long-term downtrend persists. However, a trend change cannot be ruled out, as quotes are approaching the middle line of the Bollinger Bands at 1.5625 (Murray level [4/8], W1).
Support and resistance levels
Resistance levels: 1.5625, 1.9980, 2.3519.
Support levels: 1.3671, 1.2695, 1.0742, 0.7812.
Trading scenarios and XRP/USD price forecast
Short positions may be opened below 1.3671 with targets at 1.2695, 1.0742, 0.7812 and a stop-loss at 1.4500. Implementation period: 5–7 days.
Long positions may be opened above 1.5625 with targets at 1.9980, 2.3519 and a stop-loss at 1.4160.
Scenario
| Timeframe | Weekly |
| Recommendation | SELL STOP |
| Entry point | 1.3610 |
| Take Profit | 1.2695, 1.0742, 0.7812 |
| Stop Loss | 1.4500 |
| Key levels | 0.7812, 1.0742, 1.2695, 1.3671, 1.5625, 1.9980, 2.3519 |
Alternative scenario
| Recommendation | BUY STOP |
| Entry point | 1.5640 |
| Take Profit | 1.9980, 2.3519 |
| Stop Loss | 1.4160 |
| Key levels | 0.7812, 1.0742, 1.2695, 1.3671, 1.5625, 1.9980, 2.3519 |
