

Inflation in the EU accelerated in May from 3.0% to 3.2% year-on-year, the core indicator reached 2.5%, and the energy component rose by 10.9%. The regulator is likely to raise the interest rate by 25 basis points to 2.25%, which may put pressure on economic growth and corporate profits. At 14:45 (GMT+2), ECB President Christine Lagarde will hold a press conference. It is worth noting that in the first quarter, the region’s gross domestic product (GDP) stood at –0.2%, while employment was 0.1%, and even a possible increase in borrowing costs is unlikely to become the start of a rise in quotes: central bankers are forced to defend their price stability mandate against energy shocks, although the economy is approaching a technical recession. Against the backdrop of the blockade of the Strait of Hormuz, Brent Crude Oil is forecast at 95.00, and analysts believe that the ECB will revise its GDP forecast for 2026 from 0.9% to 0.3%, and its inflation forecast to 2.9%. Analysts expect two more increases in borrowing costs this year, with the next one possibly taking place as early as September.
The dollar is receiving support from strong macroeconomic statistics: in May, the consumer price index reached 4.2% year-on-year, the core indicator was 2.9%, nonfarm payrolls amounted to 172.0K, and unemployment remained at 4.3%. In addition, U.S. GDP reached 1.6% year-on-year in the first quarter. The U.S. Federal Reserve is currently keeping the interest rate in the range of 3.50–3.75%, but due to high inflation, investors allow for a shift toward hawkish rhetoric: according to the Chicago Mercantile Exchange (CME) FedWatch Tool, the probability of at least one increase in borrowing costs before the end of the year rose from 14.0% to 66.0–70.0%, while the yield on 10-year Treasury bonds is around 4.55–4.60%, and two-year yields are near 15-month highs. Investors remain focused on the publication of the May producer price index at 14:30 (GMT+2): according to the forecast, it will change from 3.5% to 3.9% year-on-year and from 0.5% to 0.3% month-on-month.
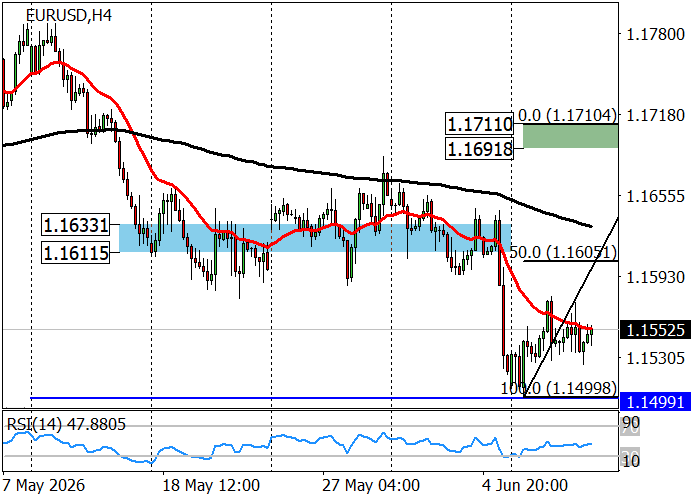
Within the long-term downtrend, last week the price broke through the support level of 1.1575 and continued moving toward the March lows of 1.1443–1.1410 and the 1.1275 mark. If the resistance level of 1.1575 is overcome, long positions with a target at 1.1686 will become relevant. The instrument is below EMA (21) and EMA (190), indicating short-term and long-term downtrends, while the RSI (14) indicator approached the oversold zone but has not yet entered it, suggesting the possibility of opening new bearish positions.
The medium-term trend turned downward last week after the breakout of the support area of 1.1633–1.1611, and now the instrument is expected to reach zone 2 at 1.1441–1.1421. In addition, short positions may be opened on a correction from the mirror resistance area of 1.1633–1.1611 or the key trend resistance area of 1.1711–1.1691, with a target at the weekly low of 1.1499.
Support and resistance levels
Resistance levels: 1.1575, 1.1686, 1.1788.
Support levels: 1.1443, 1.1410, 1.1275.
EUR/USD trading scenarios and forecast
Short positions may be opened from the 1.1575 level, with a target at 1.1443 and a stop-loss at 1.1606. Expected timeframe: 9–12 days.
Long positions may be opened above 1.1606, with a target at 1.1686 and a stop-loss at 1.1575.
Scenario
| Timeframe | Weekly |
| Recommendation | SELL LIMIT |
| Entry point | 1.1575 |
| Take Profit | 1.1443 |
| Stop Loss | 1.1606 |
| Key levels | 1.1275, 1.1410, 1.1443, 1.1575, 1.1686, 1.1788 |
Alternative scenario
| Recommendation | BUY STOP |
| Entry point | 1.1610 |
| Take Profit | 1.1686 |
| Stop Loss | 1.1575 |
| Key levels | 1.1275, 1.1410, 1.1443, 1.1575, 1.1686, 1.1788 |
