

The exchange of attacks has put the approval of a peace deal at risk. The day before, U.S. aircraft damaged military facilities on the coast of the Strait of Hormuz and destroyed four Iranian drones, while the Islamic Republic responded by striking enemy bases. In addition, the U.S. Treasury Department imposed sanctions on several Iranian officials, accusing them of extorting money from vessels passing through the key maritime route. Such developments disappointed investors who had expected a quick end to the confrontation in the Persian Gulf region and triggered weakness in risk assets. According to CoinGlass, almost 1.0 billion dollars in leveraged cryptocurrency positions were liquidated over the past 24 hours, with long positions accounting for 93.0% of losses. BTC and ETH led in liquidation volume, at 386.0 million dollars and 246.0 million dollars, respectively.
Today at 14:30 (GMT+2), the U.S. gross domestic product report for the first quarter and the April core Personal Consumption Expenditures price index will be published. If forecasts for 2.0% economic growth and an increase in the spending indicator from 3.2% to 3.3% are confirmed, the likelihood of current interest rates being maintained for a longer period, or even raised again, will increase significantly, supporting the U.S. dollar.
The negative dynamics of quotations are being somewhat restrained by the release of the XRP Ledger fixCleanup3_1_3 amendment, which fixes a number of issues related to blockchain security and usability. However, overall market sentiment has turned pessimistic again. Significant outflows from leading digital exchange-traded funds, primarily BTC-based products, continue, while the Fear and Greed Index has once again fallen into the “extreme fear” zone at 22.
Taking into account the current geopolitical and monetary factors, a further decline in XRP/USD appears quite possible.
Support and resistance levels
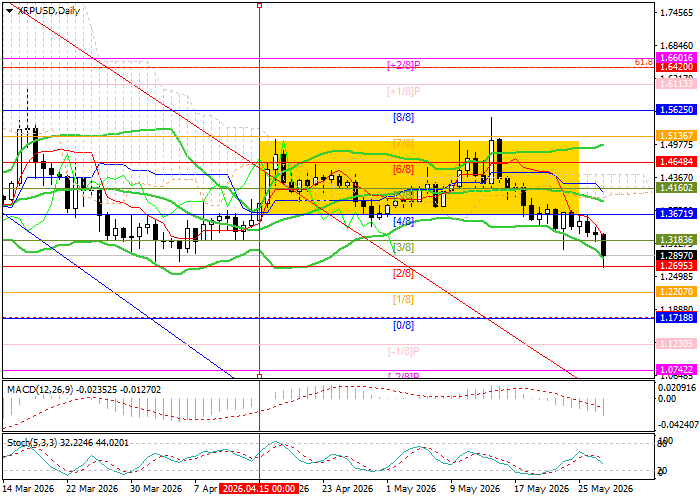
The trading instrument is testing the 1.2695 level, the Murray level [2/8]. Consolidation below it may allow the price to decline toward 1.1718, the Murray level [0/8], and 1.0742, the Murray level [–2/8]. If the price breaks back above 1.4160, the Murray level [5/8], reinforced by the middle line of the Bollinger Bands, growth toward 1.5625, the Murray level [8/8], and 1.6420, the 61.8% correction, is likely.
Technical indicators maintain a sell signal: Bollinger Bands and Stochastic are turning downward, while the MACD histogram is increasing in the negative zone. On the weekly chart, Bollinger Bands remain directed downward, confirming the continuation of the long-term downtrend.
Resistance levels: 1.4160, 1.5625, 1.6420.
Support levels: 1.2695, 1.1718, 1.0742.
XRP/USD trading scenarios and forecast
Short positions may be opened below 1.2695, with targets at 1.1718 and 1.0742 and a stop-loss at 1.3430. Expected timeframe: 5–7 days.
Long positions may be opened above 1.4160, with targets at 1.5625 and 1.6420 and a stop-loss at 1.3300.
Scenario
| Timeframe | Weekly |
| Recommendation | SELL STOP |
| Entry point | 1.2690 |
| Take Profit | 1.1718, 1.0742 |
| Stop Loss | 1.3430 |
| Key levels | 1.0742, 1.1718, 1.2695, 1.4160, 1.5625, 1.6420 |
Alternative scenario
| Recommendation | BUY STOP |
| Entry point | 1.4165 |
| Take Profit | 1.5625, 1.6420 |
| Stop Loss | 1.3300 |
| Key levels | 1.0742, 1.1718, 1.2695, 1.4160, 1.5625, 1.6420 |
