

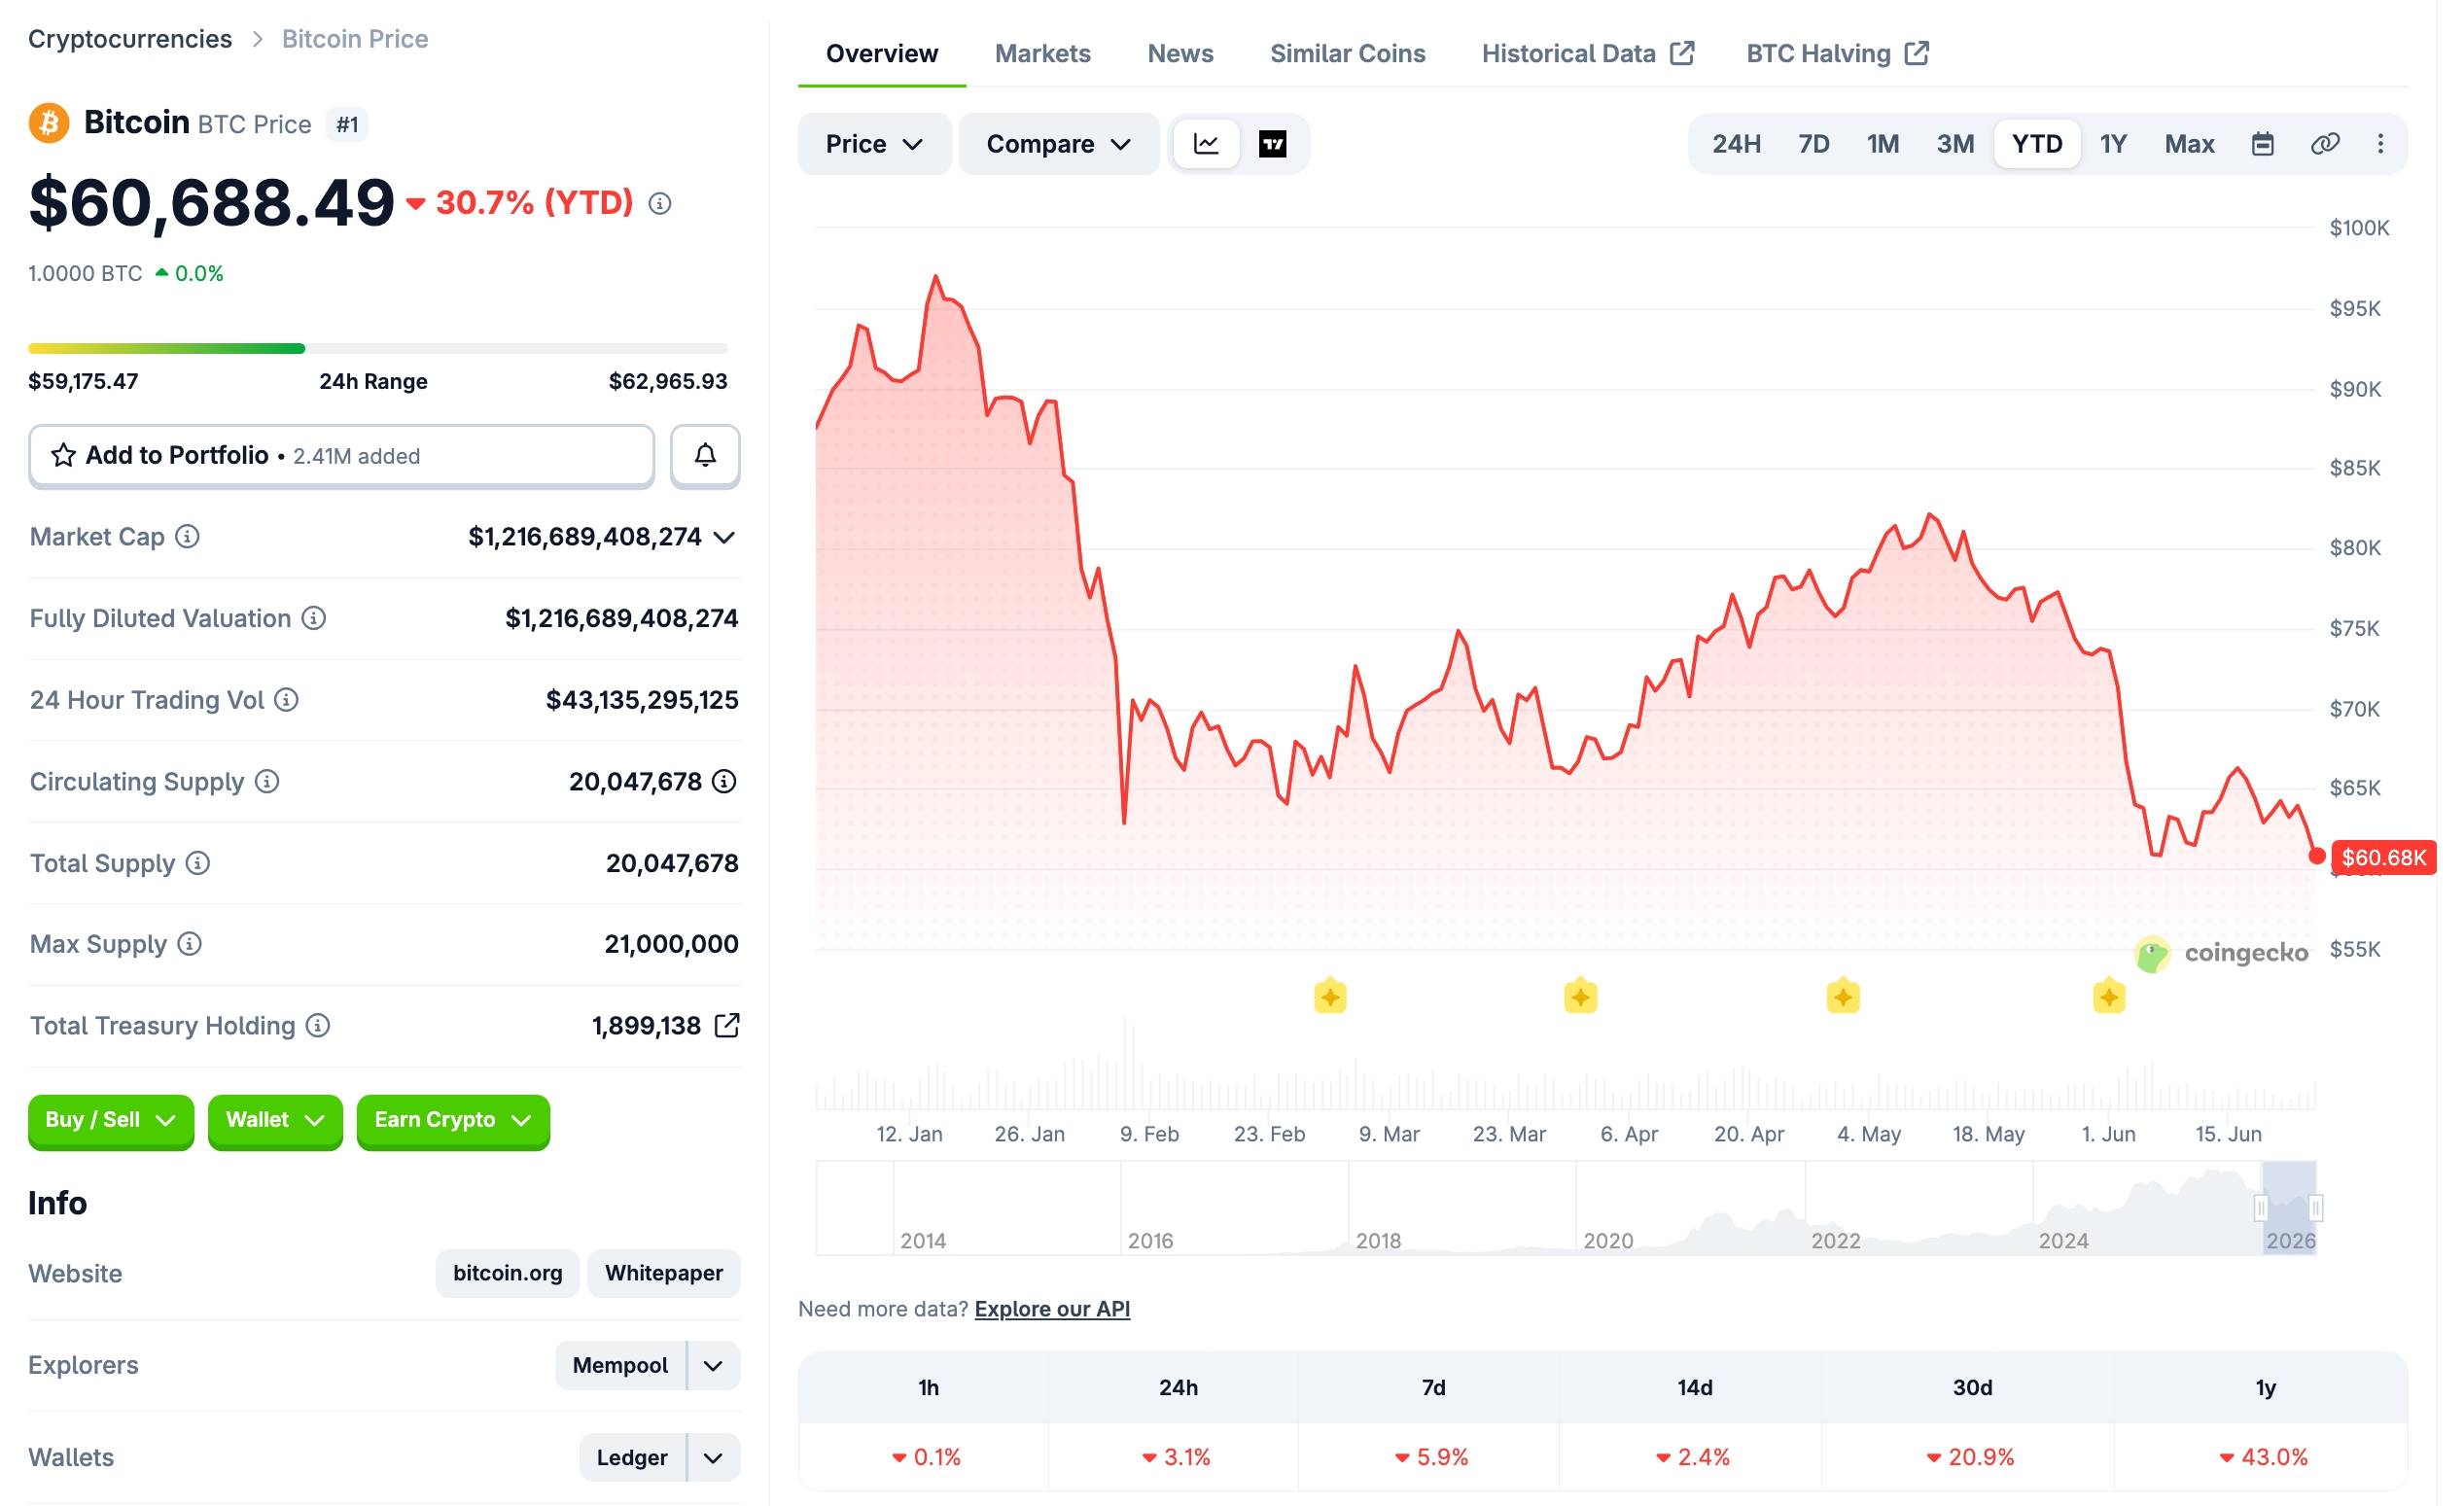
Selling pressure accelerated during the evening session on June 24, pushing Bitcoin below the psychological USD 60,000 level. At one point, the price fell to USD 59,102 before dip buyers emerged. From its all-time high of USD 126,000 reached in October 2025, the world’s largest cryptocurrency has now lost more than half of its value, erasing most of the gains made during the post-ETF growth phase that began in October 2024.
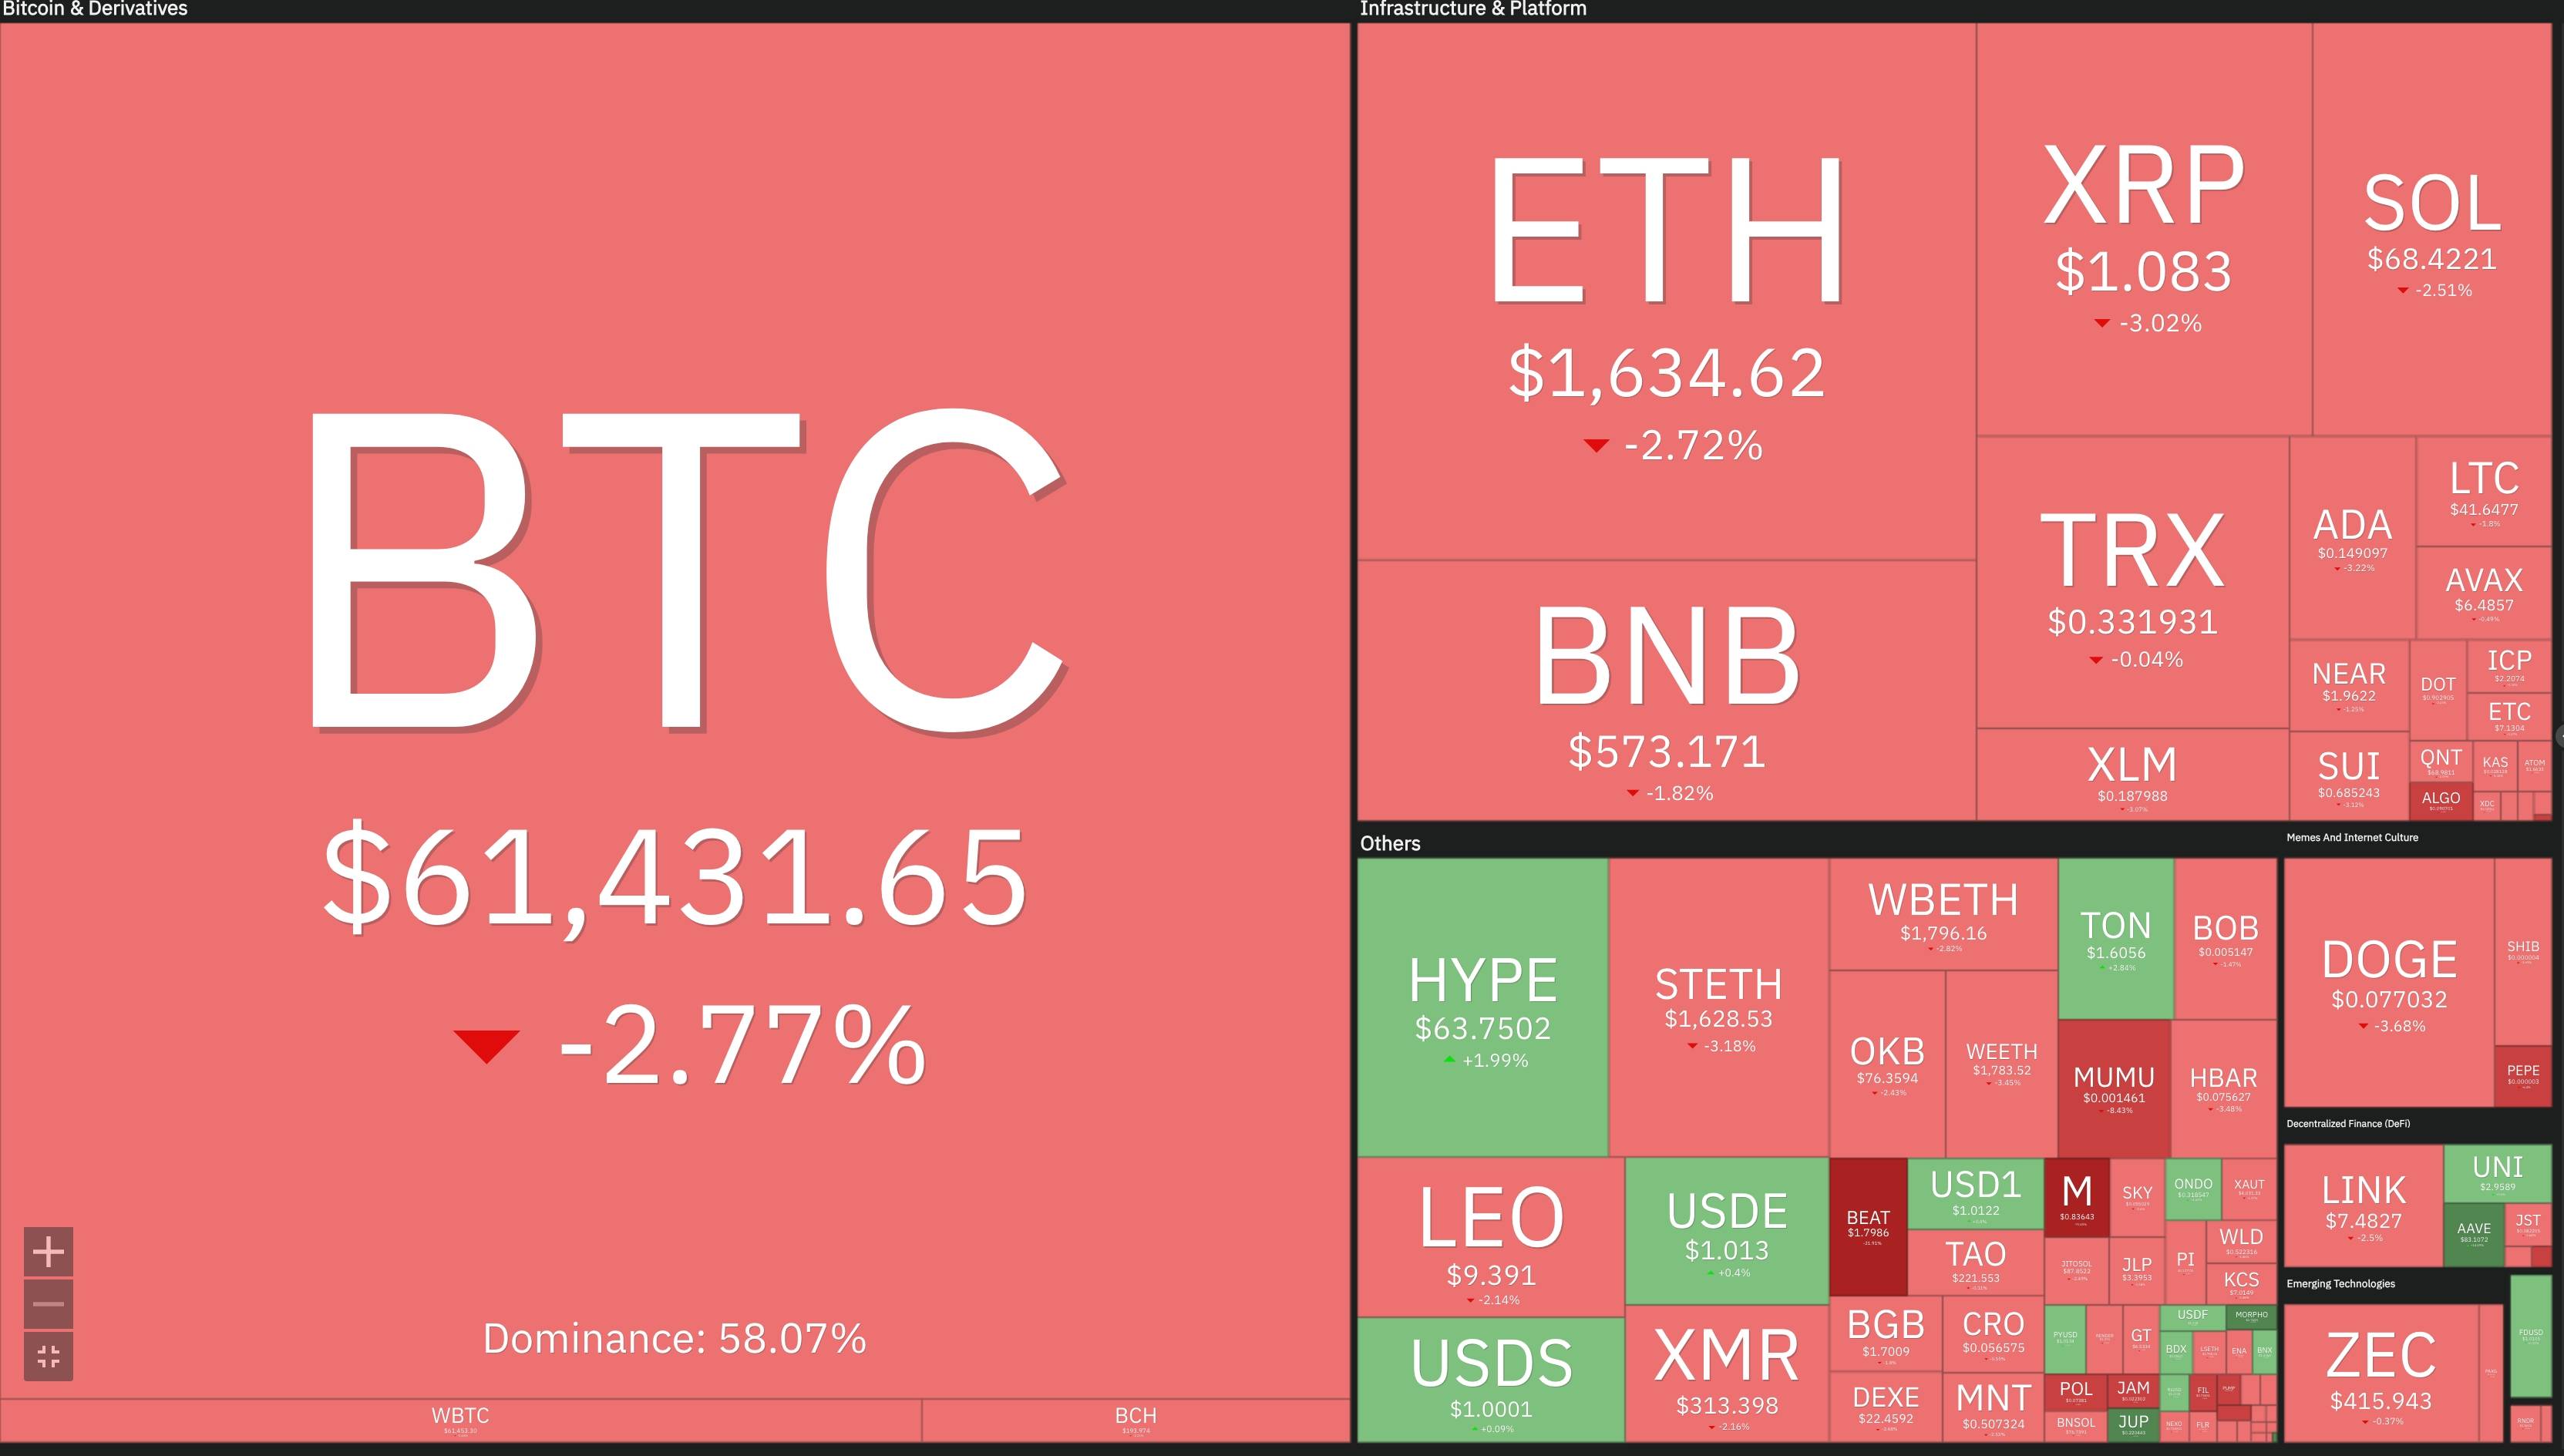
Bitcoin’s decline has spread across the broader digital asset market. Ethereum fell below USD 1,700, Solana moved close to USD 67, while XRP, Dogecoin, and Cardano each lost around 5% in a single day. This has become one of the sharpest crypto market corrections since the sell-off in early June.
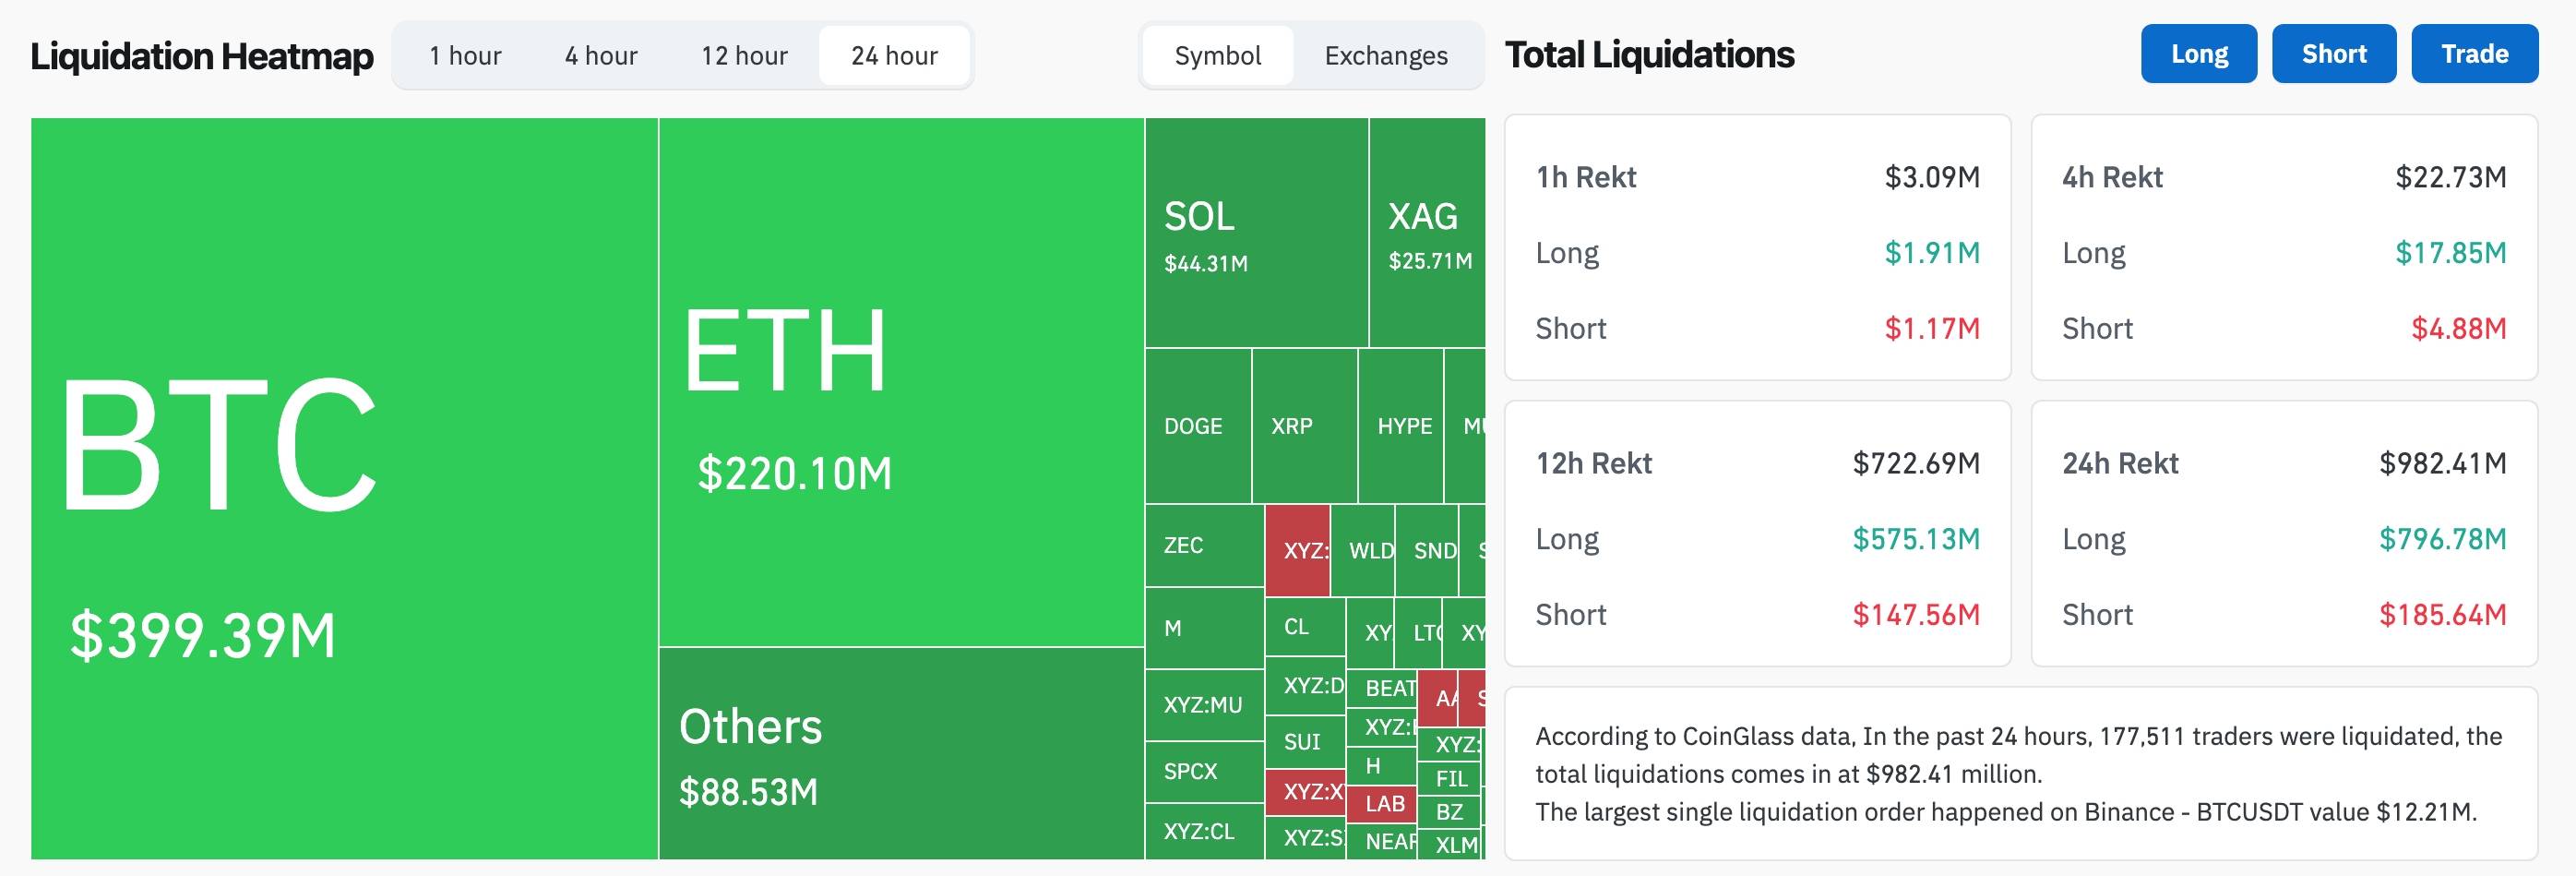
The sudden drop also triggered a major liquidation wave in the derivatives market. According to CoinGlass data, nearly USD 1 billion in leveraged positions was liquidated over the past 24 hours, with long positions accounting for around USD 788 million of losses. The largest single liquidation occurred on Binance’s BTC/USDT pair and exceeded USD 12 million.
During the latest trading session, the Nasdaq declined by 0.43%, the S&P 500 fell by 0.1%, while the Dow Jones gained 182.06 points, or 0.35%.
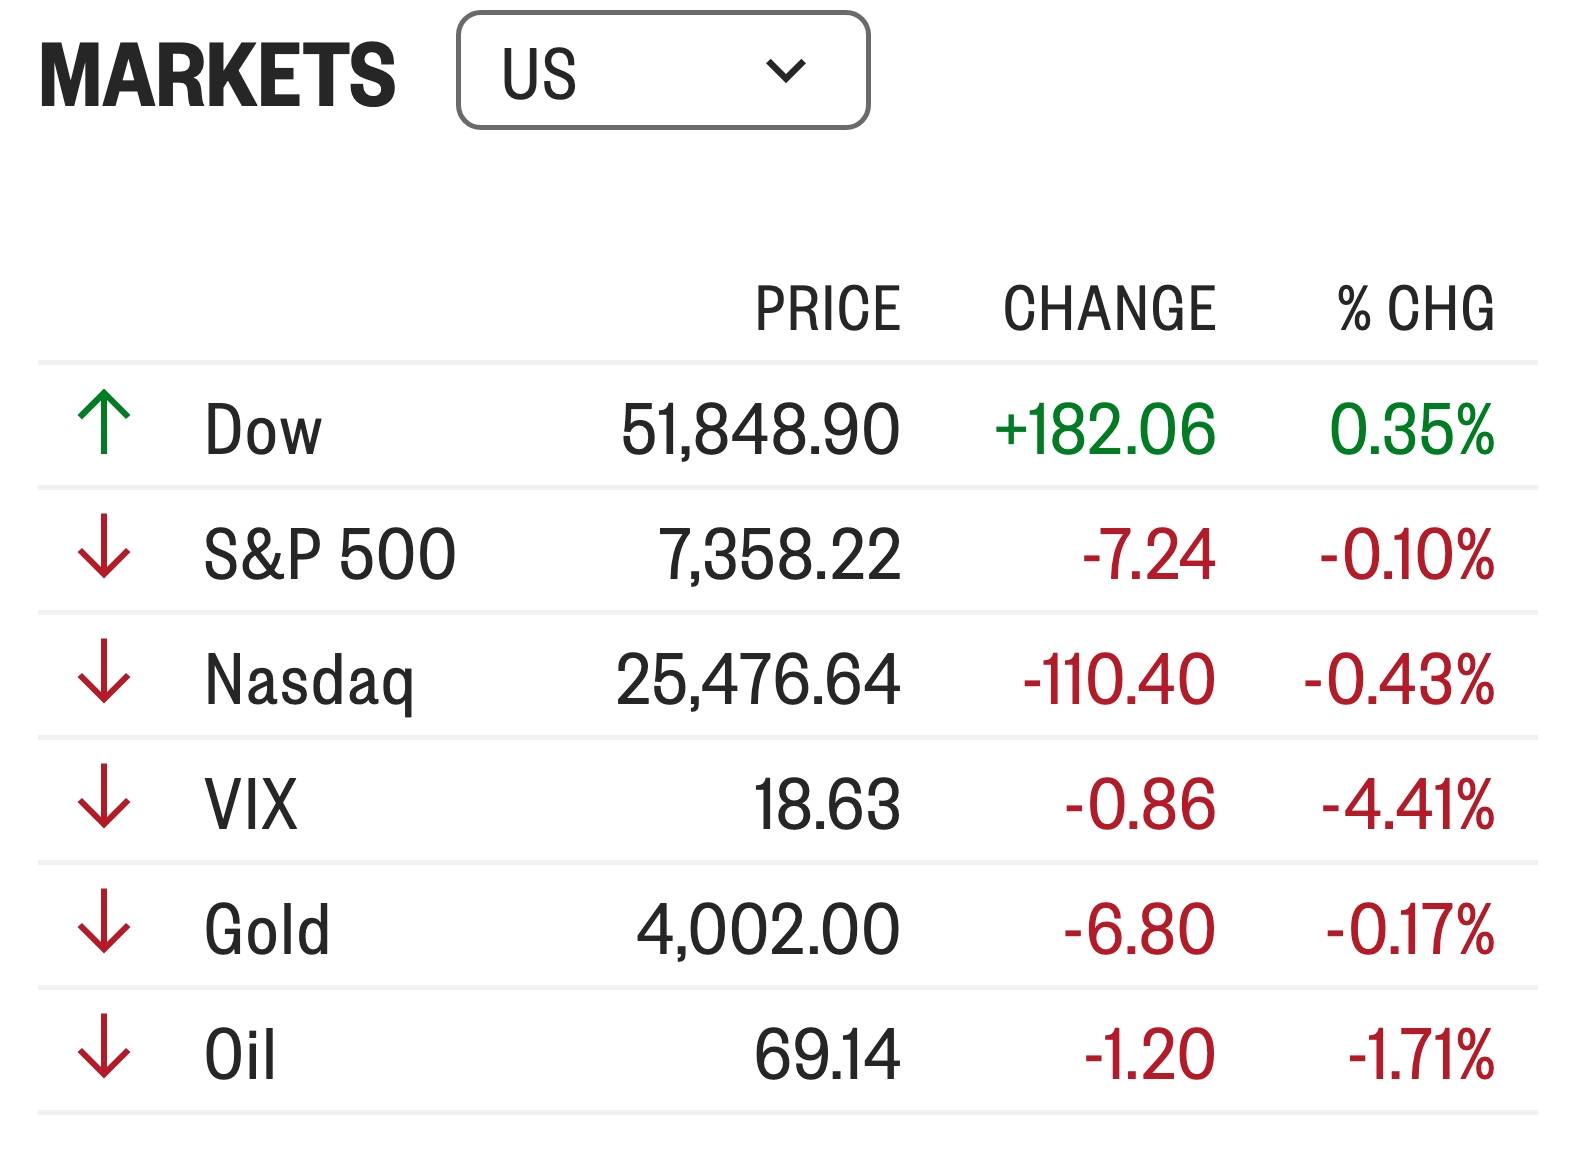
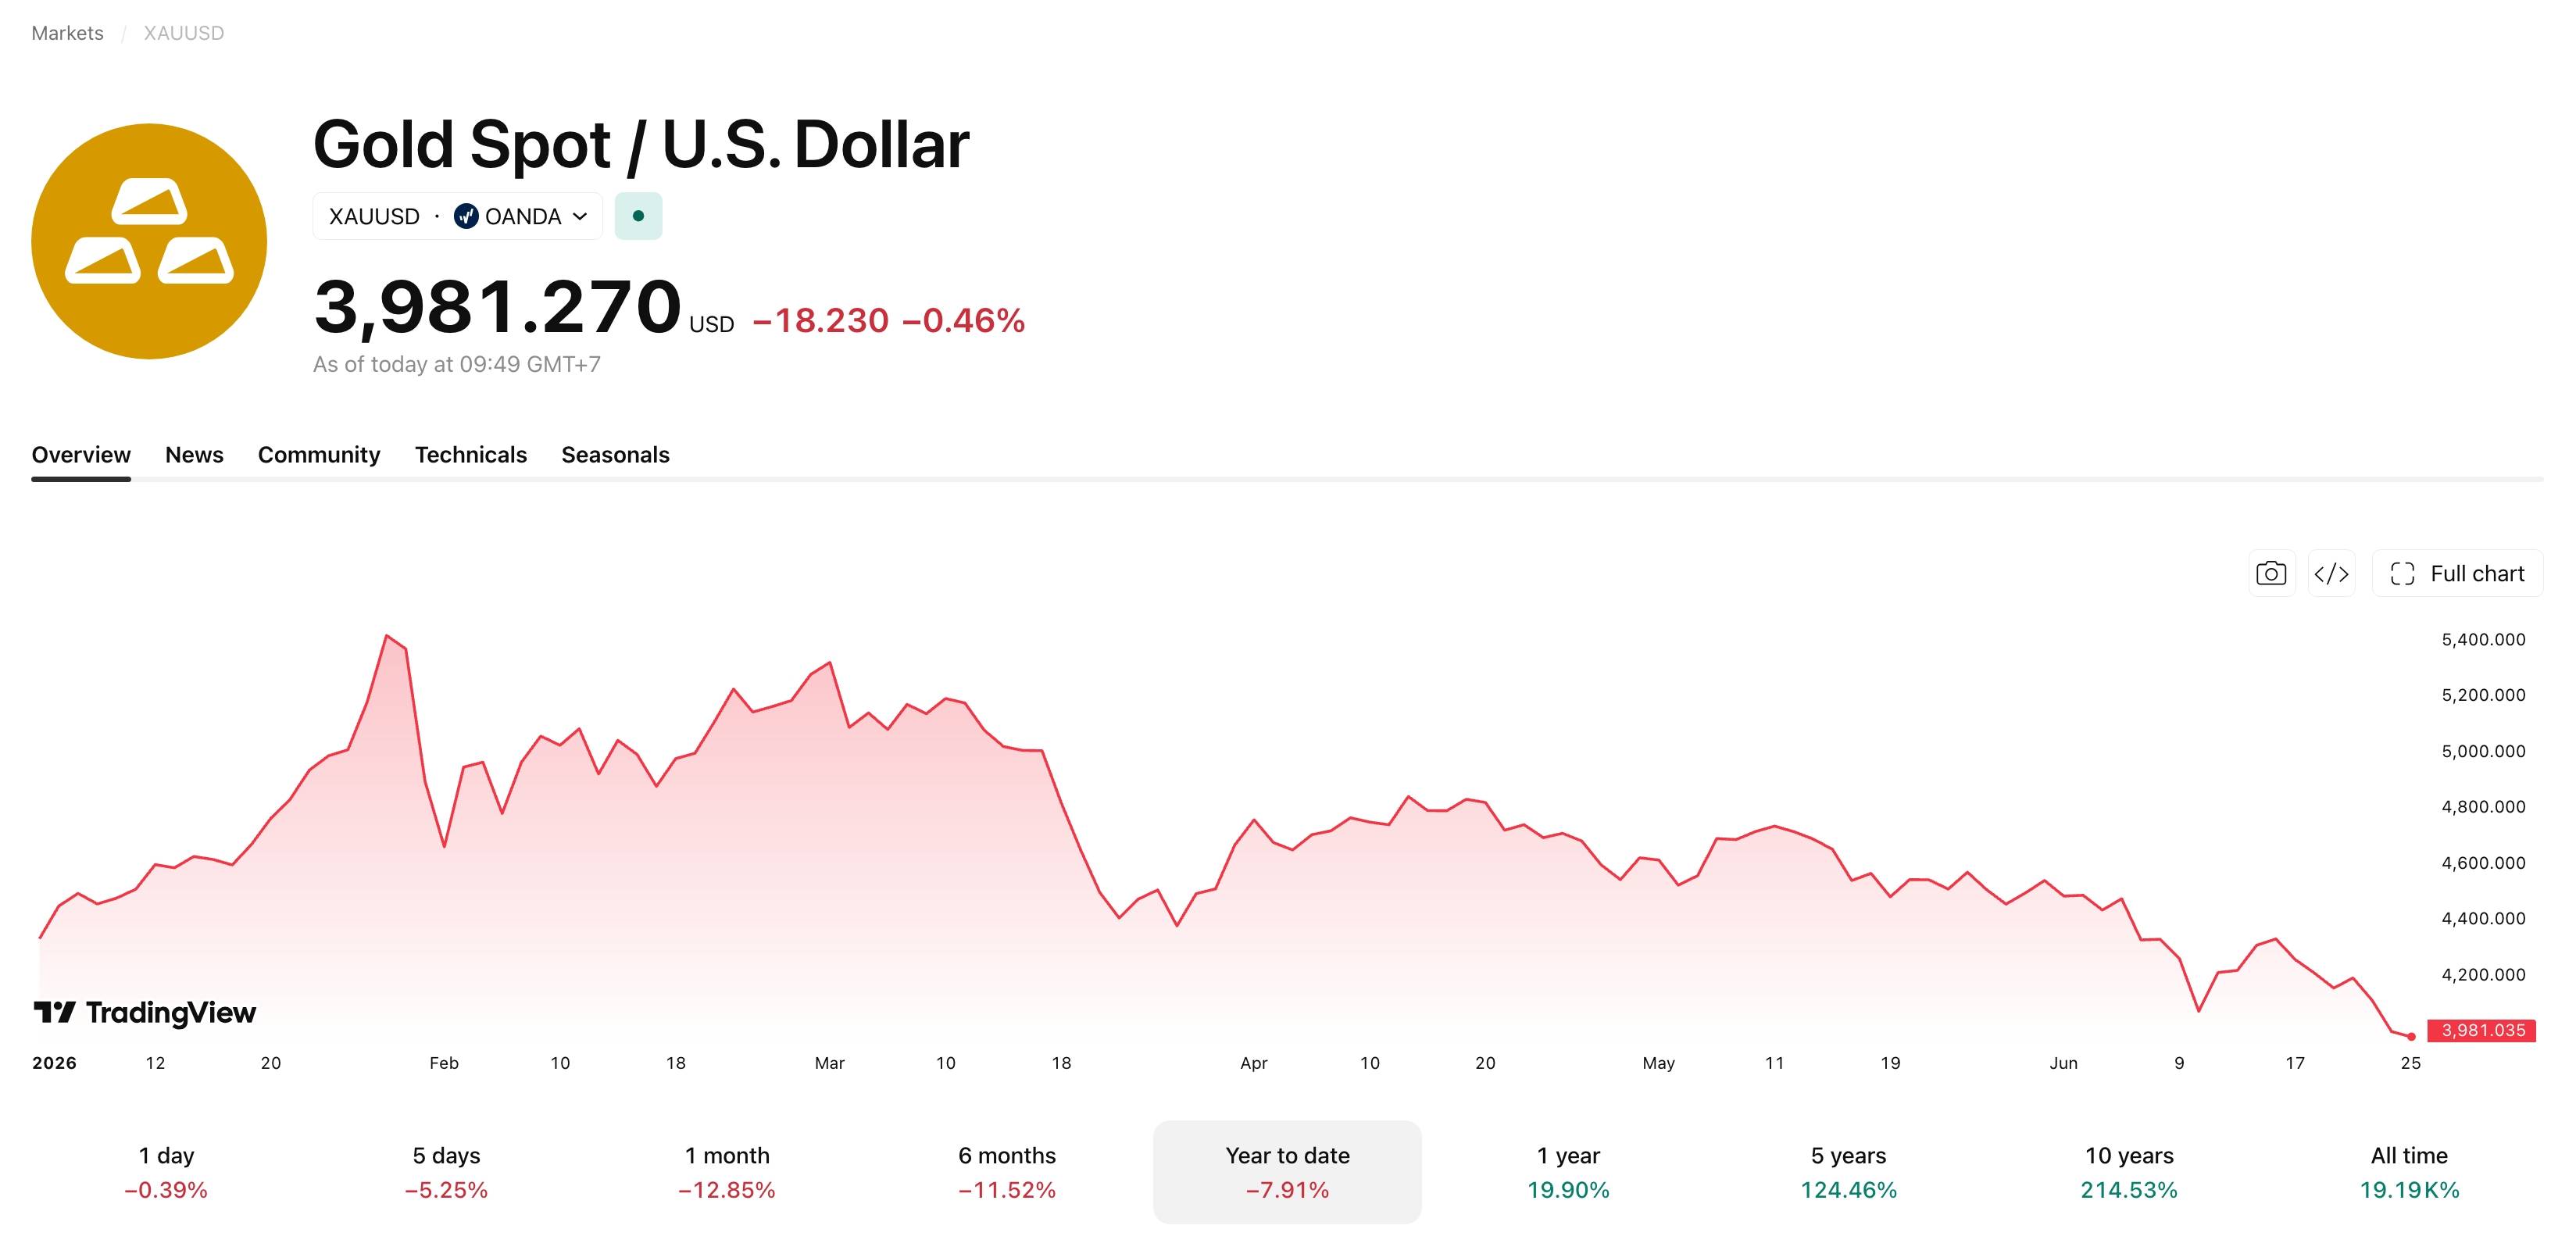
At the same time, gold fell below USD 4,000 per ounce, while crude oil dropped below USD 70 per barrel, reaching its lowest level since before the Gulf War.
One of the clearest signs of changing investor appetite is SK Hynix’s plan to raise nearly USD 30 billion in the US market. If successful, it would become one of the largest equity offerings in the world in recent years.
While crypto assets struggle with persistent selling pressure, global capital markets appear ready to assign multi-billion-dollar valuations to companies at the centre of the AI race. For many institutional investors, AI currently offers a more measurable and compelling growth story than Bitcoin.
The shift in sentiment was also reflected in comments by billionaire fund manager Philippe Laffont. Speaking to CNBC, he admitted that he has become increasingly concerned about Bitcoin’s future as investors now have more attractive opportunities, ranging from SpaceX to rapidly growing AI companies. According to Laffont, the rise of stablecoins is also reducing some of the uniqueness that once made Bitcoin an alternative to the traditional financial system.
Has Bitcoin Entered the “Dead Zone”?
The current sell-off is not only putting pressure on price but also raising doubts about one of Bitcoin’s best-known valuation models.
Bitcoin has broken below the lowest band of the Rainbow Chart, a model that tracks BTC price cycles using a logarithmic growth curve over more than a decade. With the price around USD 62,000, Bitcoin is now in the purple area labelled “Bitcoin Is Dead,” a zone that has historically appeared only during the market’s most pessimistic periods.
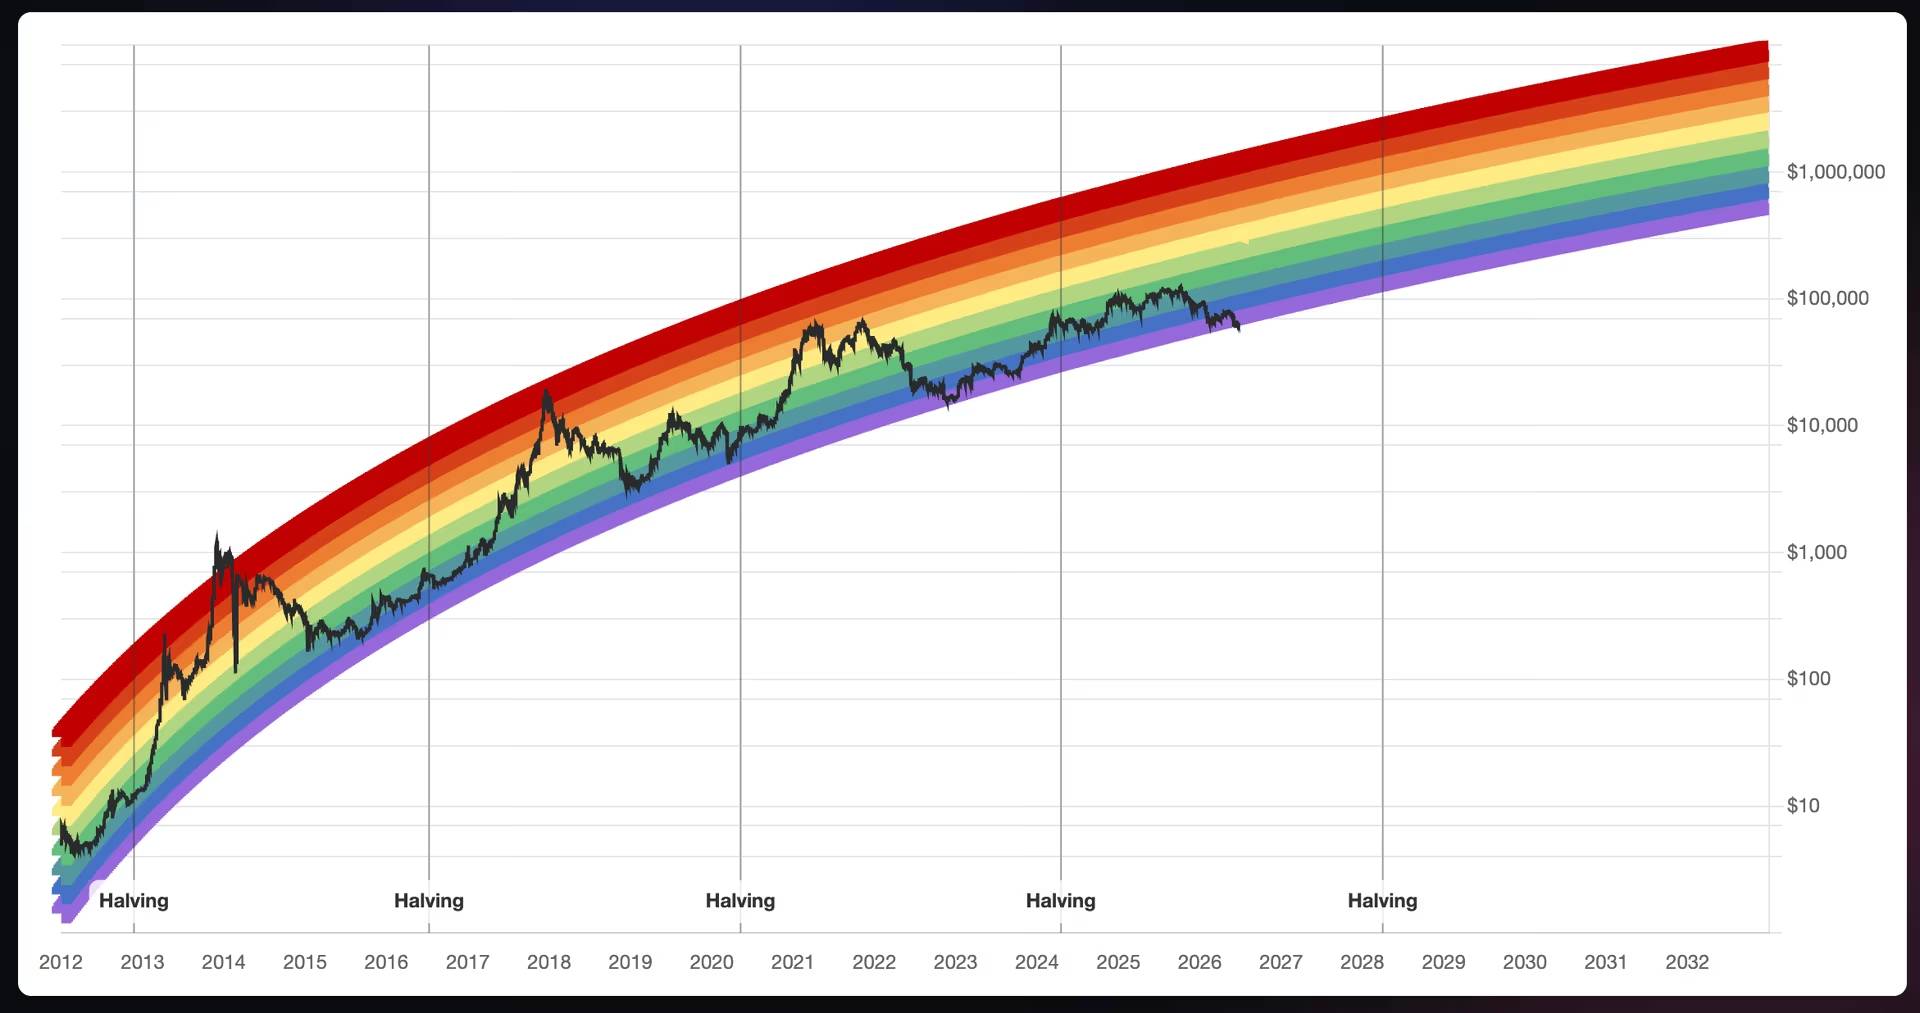
The Rainbow Chart was created in 2014 and was once considered a cycle compass for crypto investors. However, Bitcoin’s first break below the model’s entire historical support range has sparked debate over whether BTC is unusually undervalued or whether the model itself has become outdated.
Markus Levin, co-founder of XYO, believes that the event does not signal Bitcoin’s failure but instead shows that the Rainbow Chart is no longer suitable for a more mature asset. The model was developed when Bitcoin was still a small, illiquid market driven largely by retail investors. Today, Bitcoin is an asset with a market capitalisation of more than USD 1.2 trillion, increasingly influenced by ETFs, financial institutions, and global macroeconomic capital flows.
Other analysts agree that the Rainbow Chart is becoming more of a sentiment indicator than a reliable price forecasting tool.
In fact, the Rainbow Chart is not the only model facing difficulties. The Stock-to-Flow model, once highly popular in the crypto community, also failed to predict the post-halving rally in 2024, as Bitcoin did not reach the price levels expected by the model.
Is Bitcoin Unusually Cheap, or Has the Four-Year Cycle Changed?
What confuses investors is that Bitcoin has almost returned to the price range seen during the April 2024 halving, which sharply contrasts with expectations of a post-halving growth cycle similar to previous periods. However, not everyone is pessimistic.
Many analysts believe that Bitcoin entering the “dead zone” has historically marked periods of extreme fear rather than a signal of permanent collapse. Previous appearances in 2015, 2018, and during the COVID-19 shock in 2020 were followed by strong recovery cycles.
Reuters notes that USD 60,000 is currently Bitcoin’s most important psychological and technical support area. If this level is decisively broken for several consecutive sessions, the market could see a deeper decline toward USD 50,000. Conversely, to reverse the trend, Bitcoin would need to reclaim the USD 75,000–79,000 range, where key long-term moving averages are concentrated.
