

In particular, the White House refused to recognize Tehran’s right to develop a peaceful nuclear program and control the Strait of Hormuz, while attacks by the Israel Defense Forces on Lebanese territory did not cease, preventing the parties from reaching a consensus and potentially causing hostilities to resume in the near future. In addition, beginning today, the United States is starting a blockade of the Strait of Hormuz, which will undoubtedly worsen the global economic situation, since official Tehran may block the Bab-el-Mandeb Strait, which would have an extremely negative impact on logistics chains and energy transportation costs for consumers. Meanwhile, the detention of vessels from third countries leaving Iranian waters could become a catalyst for worsening relations between the United States and China, which actively trades with Iran, thereby reigniting the tariff conflict between the world’s two leading economies. On the other hand, the US dollar is being supported by rising expectations that the Federal Reserve will maintain its current monetary policy for a prolonged period amid accelerating inflation. According to the March data published on Friday, the annual consumer price index rose from 2.4% to 3.3%, while the core figure increased from 2.5% to 2.6%, which, together with a strong labor market, gives monetary authorities grounds to keep borrowing costs in the 3.50–3.75% range at least until the end of the year. As a result, the combination of these factors has worsened overall sentiment among cryptocurrency investors, as confirmed by the drop in the Fear and Greed Index to 12, and it cannot be ruled out that outflows from digital exchange-traded funds (ETFs) may resume this week as well.
Overall, the situation in the cryptocurrency market remains dependent on geopolitical signals, but since the latest ones are negative, further decline in the BTC/USD pair appears to be the most likely scenario.
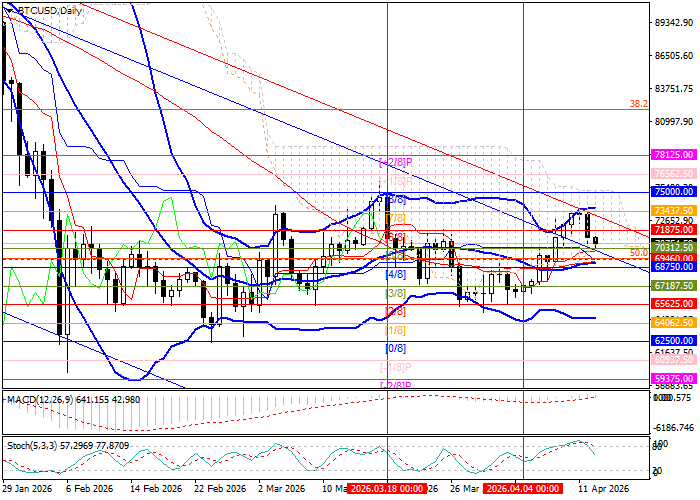
Support and resistance levels
The instrument is close to the support zone of 0.69640–0.68750 (50.0% Fibonacci retracement, Murray level [4/8], Bollinger Bands middle line), a breakout of which would act as a catalyst for stronger downward momentum toward 65625.00 (Murray level [2/8]) and 62500.00 (Murray level [0/8]). The 73437.50 level (Murray level [7/8]) is key for the bulls: consolidation above it would allow the price to exit the descending channel and resume movement toward the targets of 76562.50 (Murray level [4/8]–[+1/8]) and 78125.00 (Murray level [+2/8]).
Technical indicators do not provide a unified signal: Bollinger Bands are horizontal, the MACD histogram remains stable in positive territory, while Stochastic is turning downward from the overbought zone.
Resistance levels: 73437.50, 76562.50, 78125.00.
Support levels: 68750.0, 65625.00, 62500.00.
Trading scenarios and Bitcoin price forecast
Short positions may be opened below 0.68750 with targets at 65625.00 and 62500.00, and a stop-loss at 71300.00. Implementation period: 5–7 days.
Long positions may be opened above 73437.50 with targets at 76562.50 and 78125.00, and a stop-loss at 70500.00.
Scenario
| Timeframe | Weekly |
| Recommendation | SELL STOP |
| Entry point | 68700.00 |
| Take Profit | 65625.00, 62500.00 |
| Stop Loss | 71300.00 |
| Key levels | 62500.00, 65625.00, 73437.50, 76562.50, 78125.00 |
Alternative scenario
| Recommendation | BUY STOP |
| Entry point | 73500.00 |
| Take Profit | 76562.50, 78125.00 |
| Stop Loss | 70500.00 |
| Key levels | 62500.00, 65625.00, 73437.50, 76562.50, 78125.00 |
BTC remains highly sensitive to geopolitical headlines, and the latest signals continue to favor a cautious, risk-off stance. Unless price reclaims the 73437.50 area, downside pressure toward lower support levels is likely to remain the dominant scenario this week.
