

Leading digital assets including Bitcoin have been declining as investor conviction grows that the Federal Reserve will hold interest rates through year-end or even raise them — a view supported by the run of data released in recent weeks. In April, the Consumer Price Index rose from 3.3% to a three-year peak of 3.8% year-on-year, while the core reading climbed from 2.6% to 2.8%. The Producer Price Index surged from 4.3% to 6.0% on a headline basis and from 4.0% to 5.2% on the core measure. The labor market remains stable, as does the broader economy — May's composite PMI held at 51.7 points. This data came after the Fed's April meeting, at which officials already signaled that some additional tightening could be appropriate if inflation remains persistently above the 2.0% target. The prospect of a hawkish policy shift is supporting the dollar and weighing on assets that compete with it.
A rising frequency of security incidents is adding further pressure to the sector. Recent weeks saw attacks on the Kelp DAO protocol and the Verus-Ethereum bridge, and over the weekend analysts reported the discovery of TrapDoor malware — a strain designed to steal cloud service and wallet credentials, GitHub tokens, API keys, and other sensitive data. These reports are undermining trader confidence in the safety of crypto holdings and reducing appetite for the asset class.
Prices found some support today after President Donald Trump described peace negotiations with Iran as constructive and suggested the Strait of Hormuz could be unblocked soon. However, Iranian officials stated that the waterway would remain under Tehran's control, which capped the upside.
Negative sentiment continues to dominate, as confirmed by a $1.256 billion reduction in digital ETF balances last week. If this trend persists, year-to-date ETF investment figures could turn negative in the near term. The Fear & Greed Index is currently in the "fear" zone at a reading of 30.
Support and Resistance Levels
The pair is sitting at the 75,000.00 level (Murray level [4/8], Bollinger Bands middle line on the weekly chart). A confirmed break below this level would open the way toward 68,750.00 (Murray level [2/8], Fibonacci 50.0% retracement) and 62,500.00 (Murray level [0/8]). Conversely, a breakout above 82,000.00 (Fibonacci 38.2% retracement) would likely trigger a resumption of the uptrend toward 87,500.00 (Murray level [8/8]) and 93,750.00 (Murray level [+2/8]).
Technical indicators are sending mixed signals: the Bollinger Bands are turning downward, the MACD histogram is near the zero line with minimal volume, while the Stochastic is pointing upward but approaching the overbought zone.
Resistance levels: 82,000.00, 87,500.00, 93,750.00.
Support levels: 75,000.00, 68,750.00, 62,500.00.
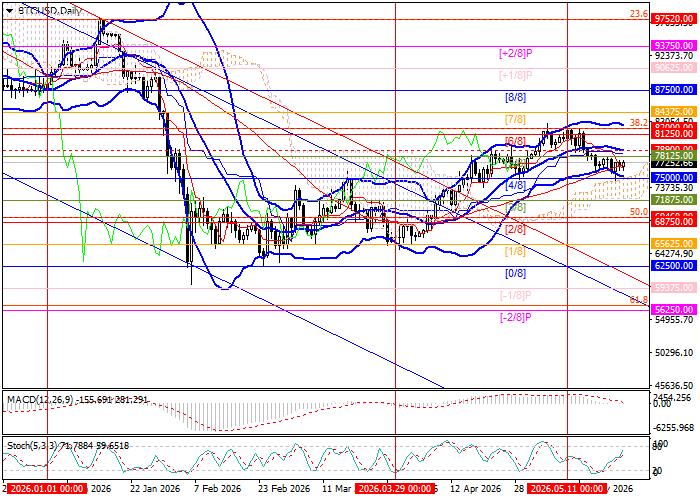
BTC/USD Trading Scenarios and Price Forecast
Short positions can be opened below 75,000.00, targeting 68,750.00 and 62,500.00, with a stop-loss at 78,000.00. Time horizon: 5–7 days. Long positions can be opened above 82,000.00, targeting 87,500.00 and 93,750.00, with a stop-loss at 78,900.00.
| Scenario | |
|---|---|
| Timeframe | Weekly |
| Recommendation | SELL STOP |
| Entry Point | 74,999.95 |
| Take Profit | 68,750.00, 62,500.00 |
| Stop Loss | 78,000.00 |
| Key Levels | 62,500.00, 68,750.00, 75,000.00, 82,000.00, 87,500.00, 93,750.00 |
| Alternative Scenario | |
|---|---|
| Recommendation | BUY STOP |
| Entry Point | 82,000.05 |
| Take Profit | 87,500.00, 93,750.00 |
| Stop Loss | 78,900.00 |
| Key Levels | 62,500.00, 68,750.00, 75,000.00, 82,000.00, 87,500.00, 93,750.00 |
