
Top Pick
- Fully licensed and regulated US exchange
- Strong focus on security and compliance
- User-friendly interface for beginners

The cryptocurrency market strengthened earlier this week but came under sharp selling pressure on Thursday, erasing much of its previous gains. In the latest market snapshot, Bitcoin (BTC) is trading near 81600.00 (+0.9%), Ethereum (ETH) at 2400.00 (+2.1%), Tether (USDT) at 0.9991 (–0.01%), BNB at 744.00 (+5.1%) and XRP at 1.3250 (+4.8%). Total cryptocurrency market capitalization has declined to approximately $2.73 trillion, while Bitcoin dominance has increased to 60.0%. From October 19 to 22, US spot Bitcoin ETFs recorded net inflows of $439.1 million, while Ethereum ETFs saw outflows of $225.1 million. The market remains volatile despite the recovery attempt discussed in our previous crypto weekly review.

 By John Isige
 One of the most high-profile sagas in the history of the crypto market has come to an end. Do Kwon — the central figure behind the multi-billion-dollar fraud tied to the Terra (LUNA) ecosystem — has been sentenced to 15 years in prison.

 By Andrew Bennett
 Midnight is sparking heated debate after its explosive debut — is it a technological breakthrough or an overhyped newcomer? And what should investors be watching right now?
 By John Isige
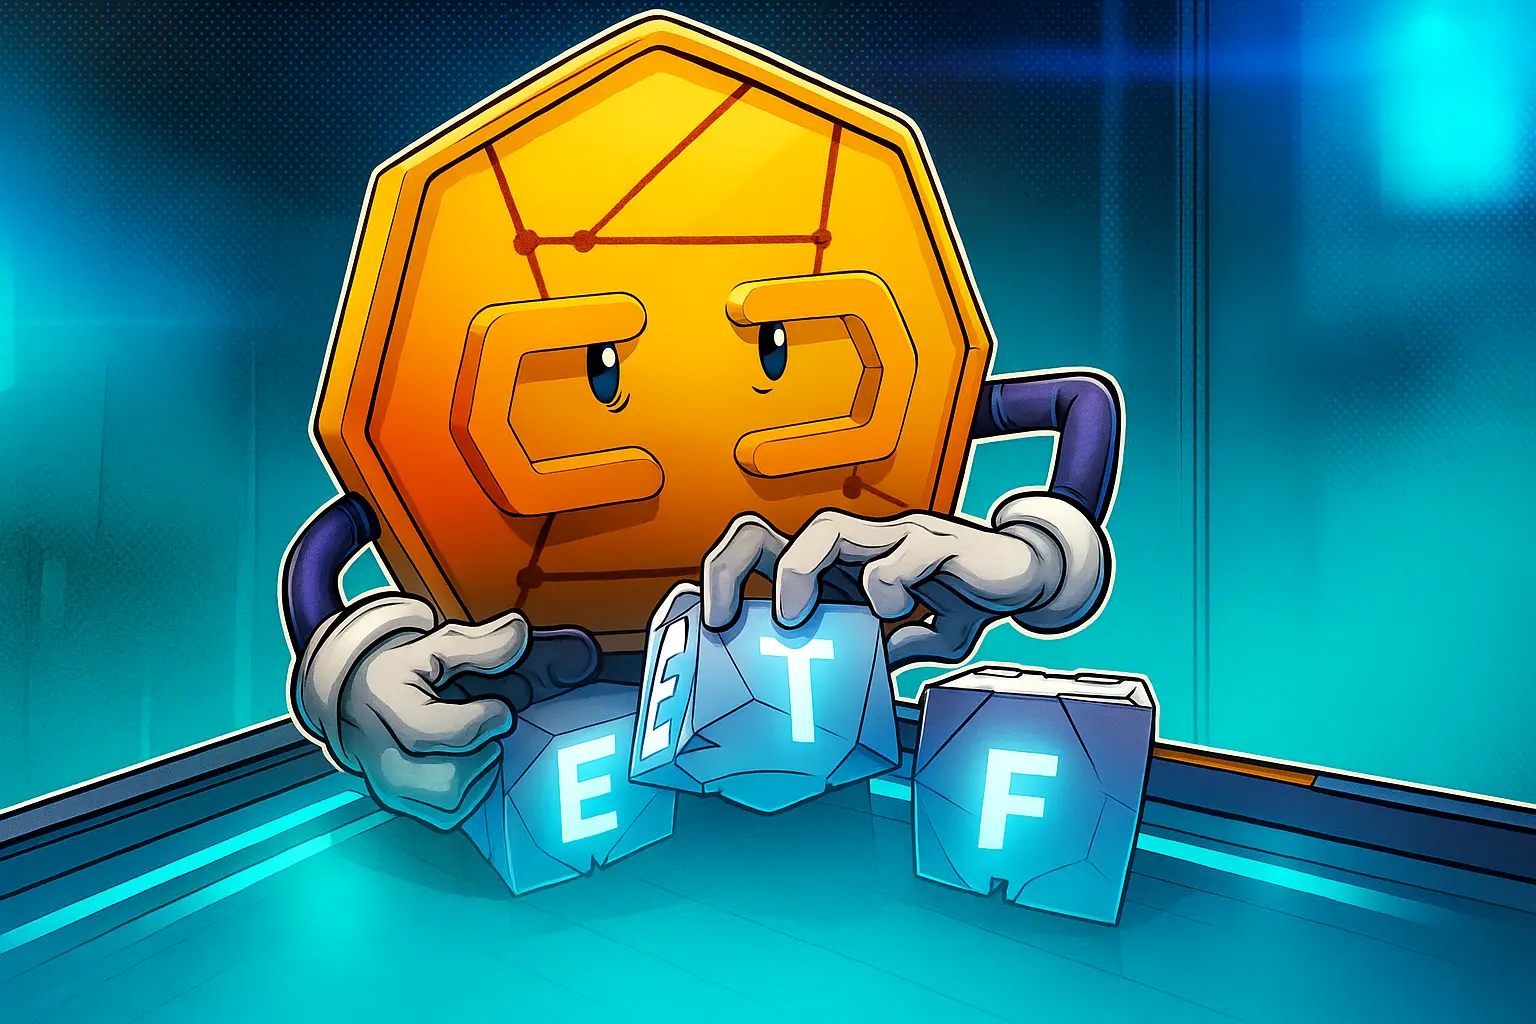
 The crypto market continues to move sideways, but XRP is attracting growing attention amid the launch of new ETF products. An increasing number of institutional players are betting on the token’s long-term potential.
 By John Isige
 SOL/USD is trading within a medium-term downtrend, forming a corresponding descending channel, but the price has currently met strong resistance at 125.00 (Murray level [5/8]) and moved into a mostly sideways range of 143.00–125.00 (23.6% Fibonacci retracement, Murray level [5/8]). Today, quotes are again approaching the lower boundary of this range under pressure from Fed projections suggesting policymakers may opt for only one rate change next year.
 By John Isige
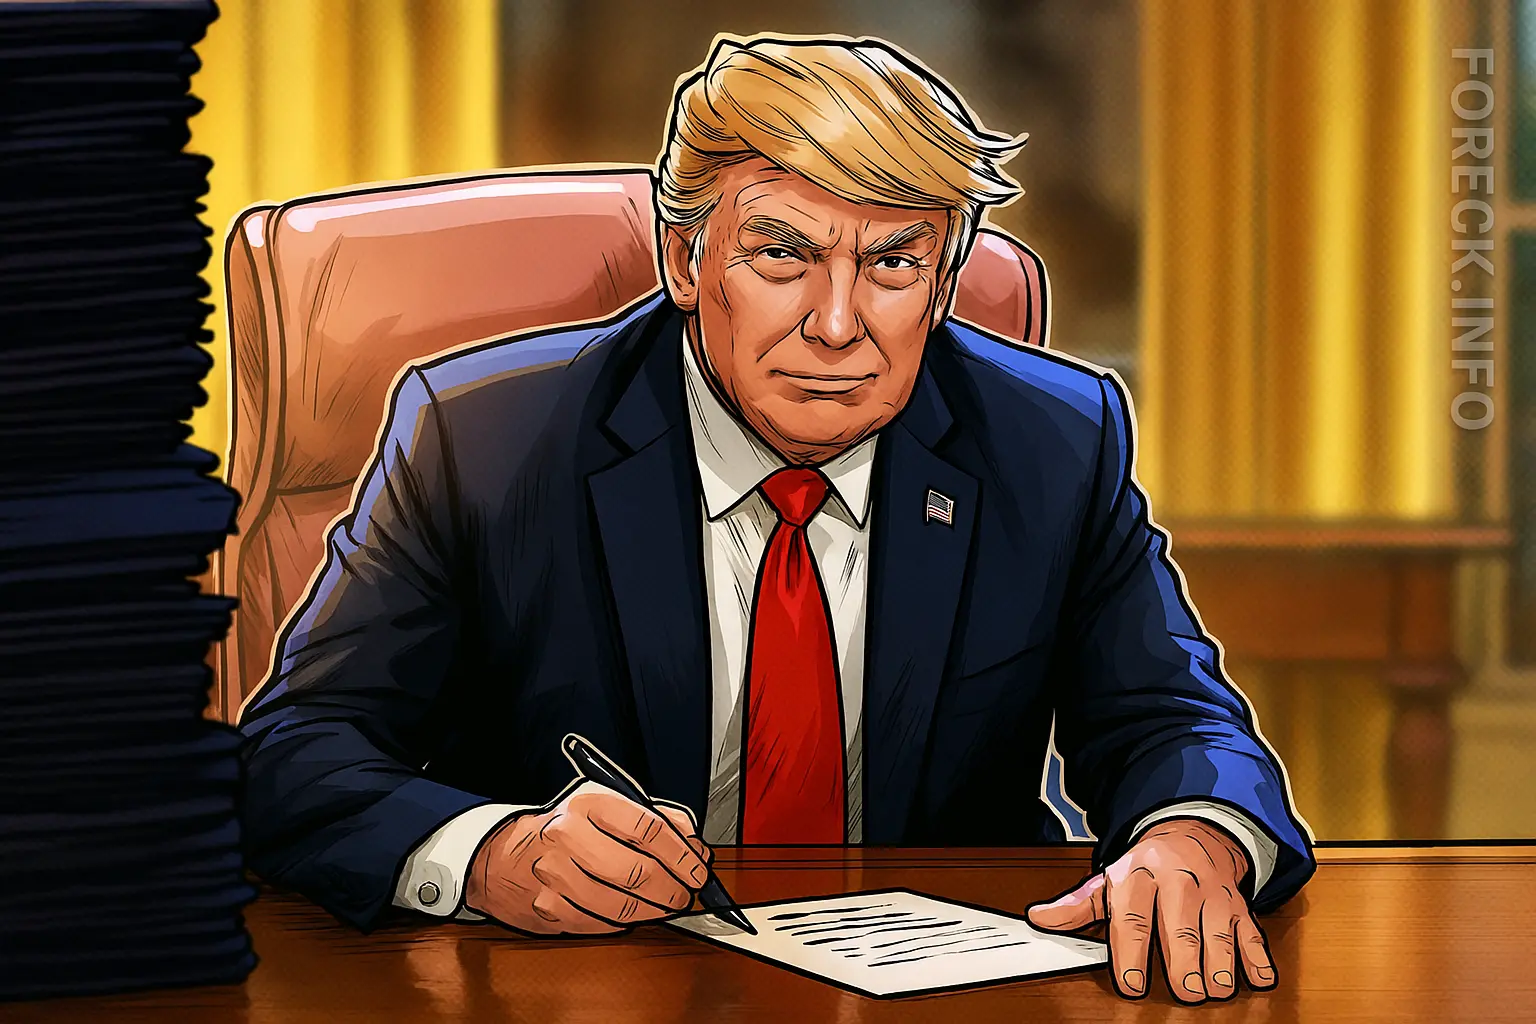
 Republicans expressed sharp dissatisfaction on Wednesday after the House of Representatives approved a $900 billion defense bill without the promised ban on Central Bank Digital Currencies (CBDCs). The vote sent the National Defense Authorization Act (NDAA) to the Senate. GOP lawmakers said party leaders removed the anti-CBDC provision despite earlier assurances. The central question now is whether Republicans are willing to block a must-pass bill over missing financial language.
 By John Isige
 Cathie Wood challenged one of Bitcoin’s oldest narratives in a recent TV interview, arguing that the market has entered a new phase defined by institutional capital flows.
 By John Isige
 Elon Musk, a well-known Dogecoin supporter, plans to take his company SpaceX public and is targeting a valuation of around 1.5 trillion US dollars. This could have a positive impact on DOGE.
 By John Isige
 The XRP/USD pair is trading within a medium-term downtrend, forming the corresponding channel. This week, the price attempted a corrective move amid expectations of another Federal Reserve rate cut, testing 2.1484 (Murray level [3/8]), supported by the middle Bollinger Band, but has not yet managed to break above it.
 By John Isige
 Bitcoin is rallying ahead of the Federal Reserve’s rate decision, with the market’s next move likely to hinge on today’s FOMC meeting.
 By John Isige
 The ETH/USD pair continues to form a medium-term bearish trend, but since last week the price has stabilized in a sideways range of 3125.00–2980.00 (Murray level [2/8], 50.0% Fibonacci correction, the middle line of Bollinger Bands), where it remains currently.
 By Andrew Bennett
 USPD has published a recovery roadmap following the December 4 exploit that allowed an attacker to mint 98 million USPD and drain about $1 million in stETH from the protocol. The team said the incident was caused by a hidden proxy deployment, and announced that USPD V1 is permanently shut down. A full rebuild, compensation model and a new V2 release are now planned for early 2026.
 By Andrew Bennett
 Ethereum has completed one of its most significant scaling milestones to date: PeerDAS — a new data availability system introduced through the Fusaka upgrade — has reshaped how the network processes and verifies Layer-2 data. Vitalik Buterin described the innovation as “heroic engineering,” stating that PeerDAS demonstrates a new level of reliability inside Ethereum’s peer-to-peer network.


For crypto, the framework is similar to traditional financial markets but comes with its own twist. Here, price action turns on liquidity, adoption, regulation, and flows from institutions alongside retail sentiment. Network health—hash rate, staking, active wallets—adds another layer. Macro still matters too: rates, dollar strength, and risk appetite shape inflows and outflows. Then, as with any market, you use the chart—trend, support and resistance, momentum, and volume—to spot setups and manage risk.