




Top Pick
- Fully licensed and regulated US exchange
- Strong focus on security and compliance
- User-friendly interface for beginners

BTC/USD traded near 78,900.00 early Wednesday after briefly breaking above 81,000.00 for the first time since May. The price later slipped below 78,000.00 following the release of US inflation data. Bitcoin is still up approximately 24–25% since the beginning of August, with the monthly range extending from 62,232.00 to 81,142.00.
 By John Isige
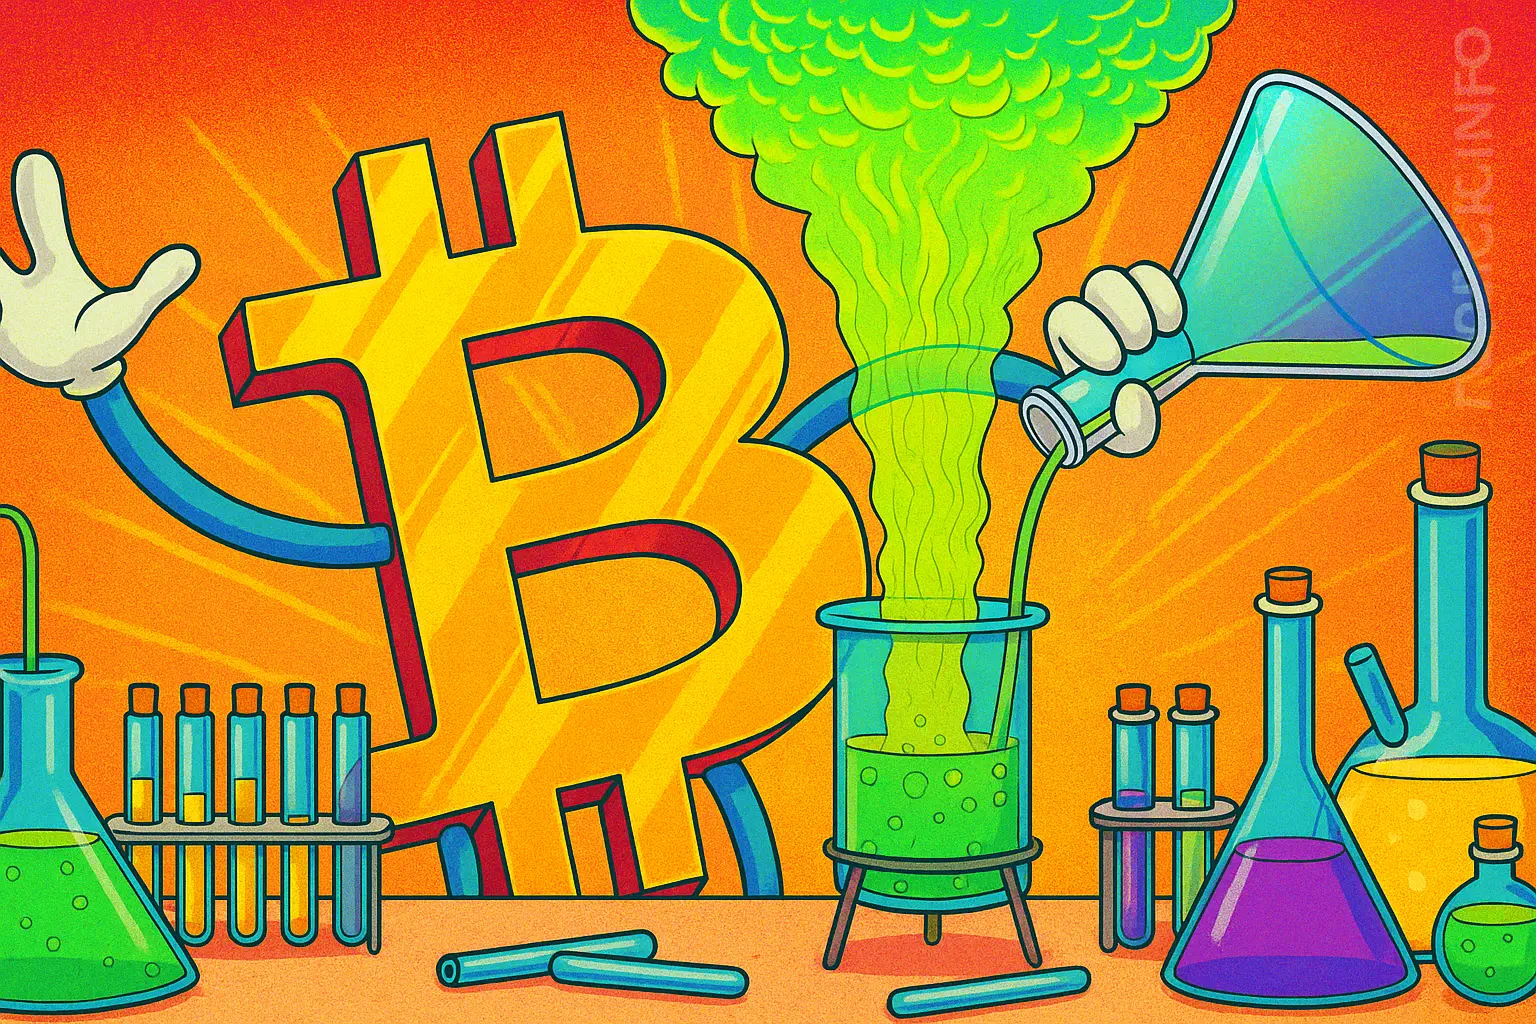
 As August 2025 opened, Bitcoin retraced back to early July levels, sparking debate among crypto investors about the fate of the current bull run. Is this the end—or just a fresh buying opportunity?
 By John Isige
 The crypto treasury arms race is rapidly expanding beyond Bitcoin and Ethereum, with Solana reserves seeing aggressive corporate accumulation in recent weeks. Upexi, for example, announced on August 5th that it boosted its SOL holdings from 735,692 tokens at the end of June to more than 2 million in July—raising over $200 million to fuel the expansion.
 By John Isige
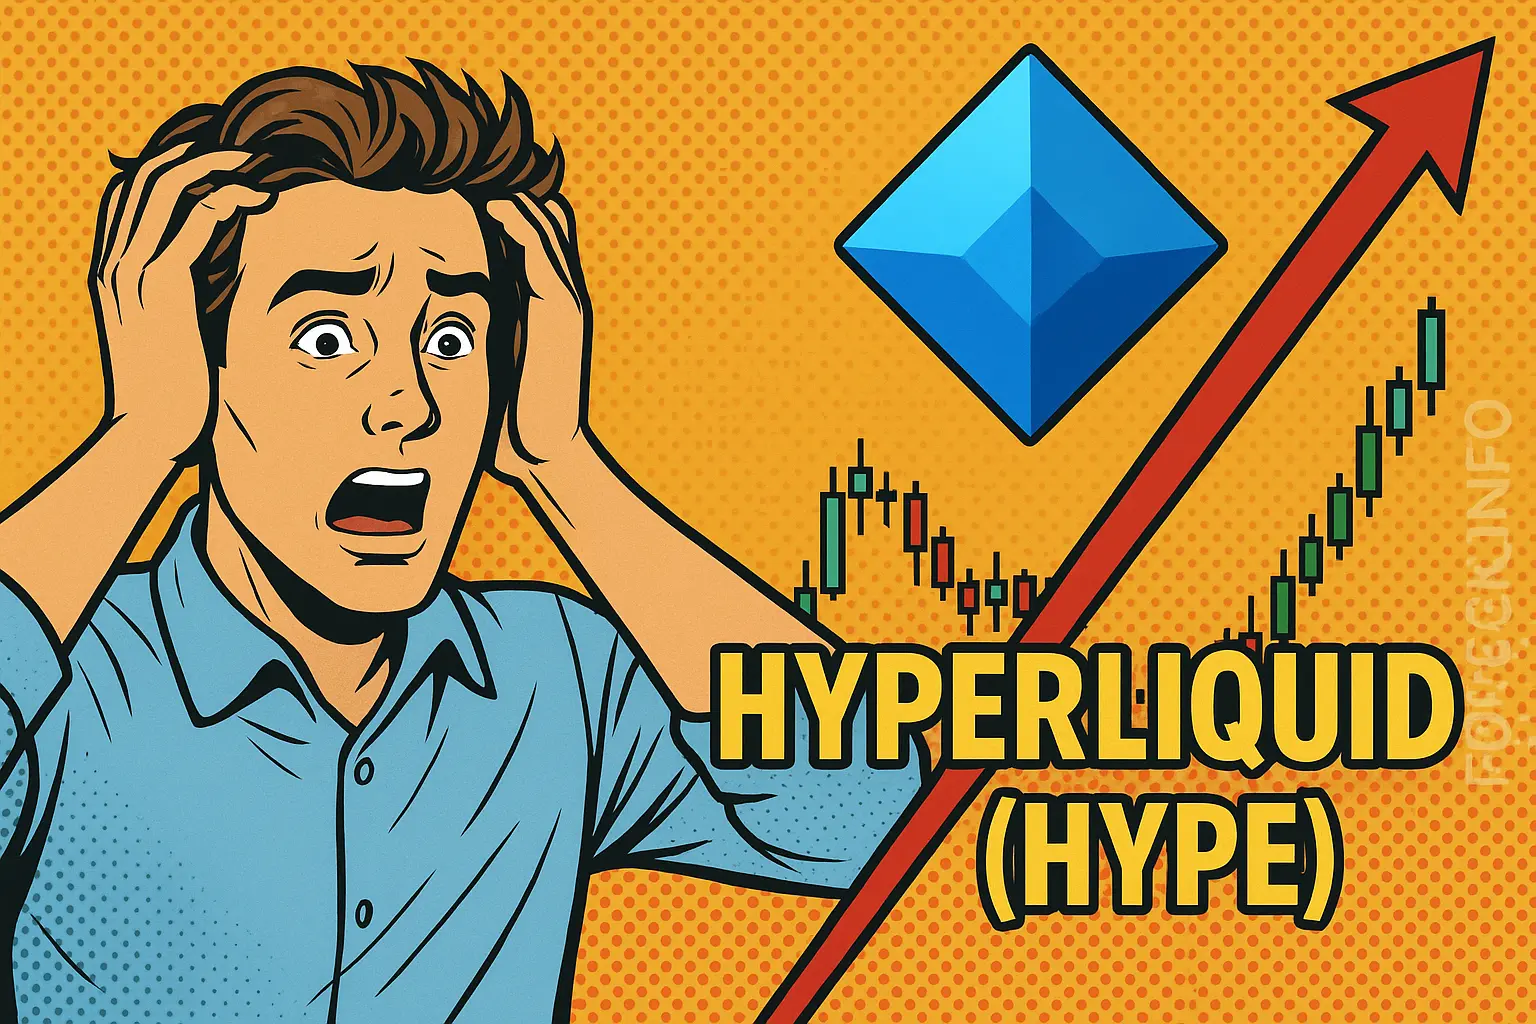
 Decentralized perpetuals exchange Hyperliquid recorded explosive growth in July, claiming 35% of all blockchain protocol revenue—a development that has come at the expense of Solana, according to VanEck analysts.
 By John Isige
 Bitcoin’s reserves on exchanges have dropped to their lowest levels since 2018, even as bearish macro data and seasonal weakness in August weigh on BTC price action. However, market structure and on-chain trends could set the stage for a reversal as early as September.
 By John Isige
 Bitcoin remains under pressure as the leading cryptocurrency retraced to its former all-time high near $112,000, signaling a continuation of the summer correction. Despite intermittent recoveries, BTC/USD is currently trading around $113,116—down nearly 5% week-on-week. The key question: Can bulls engineer a turnaround, or is further downside likely?
 By John Isige
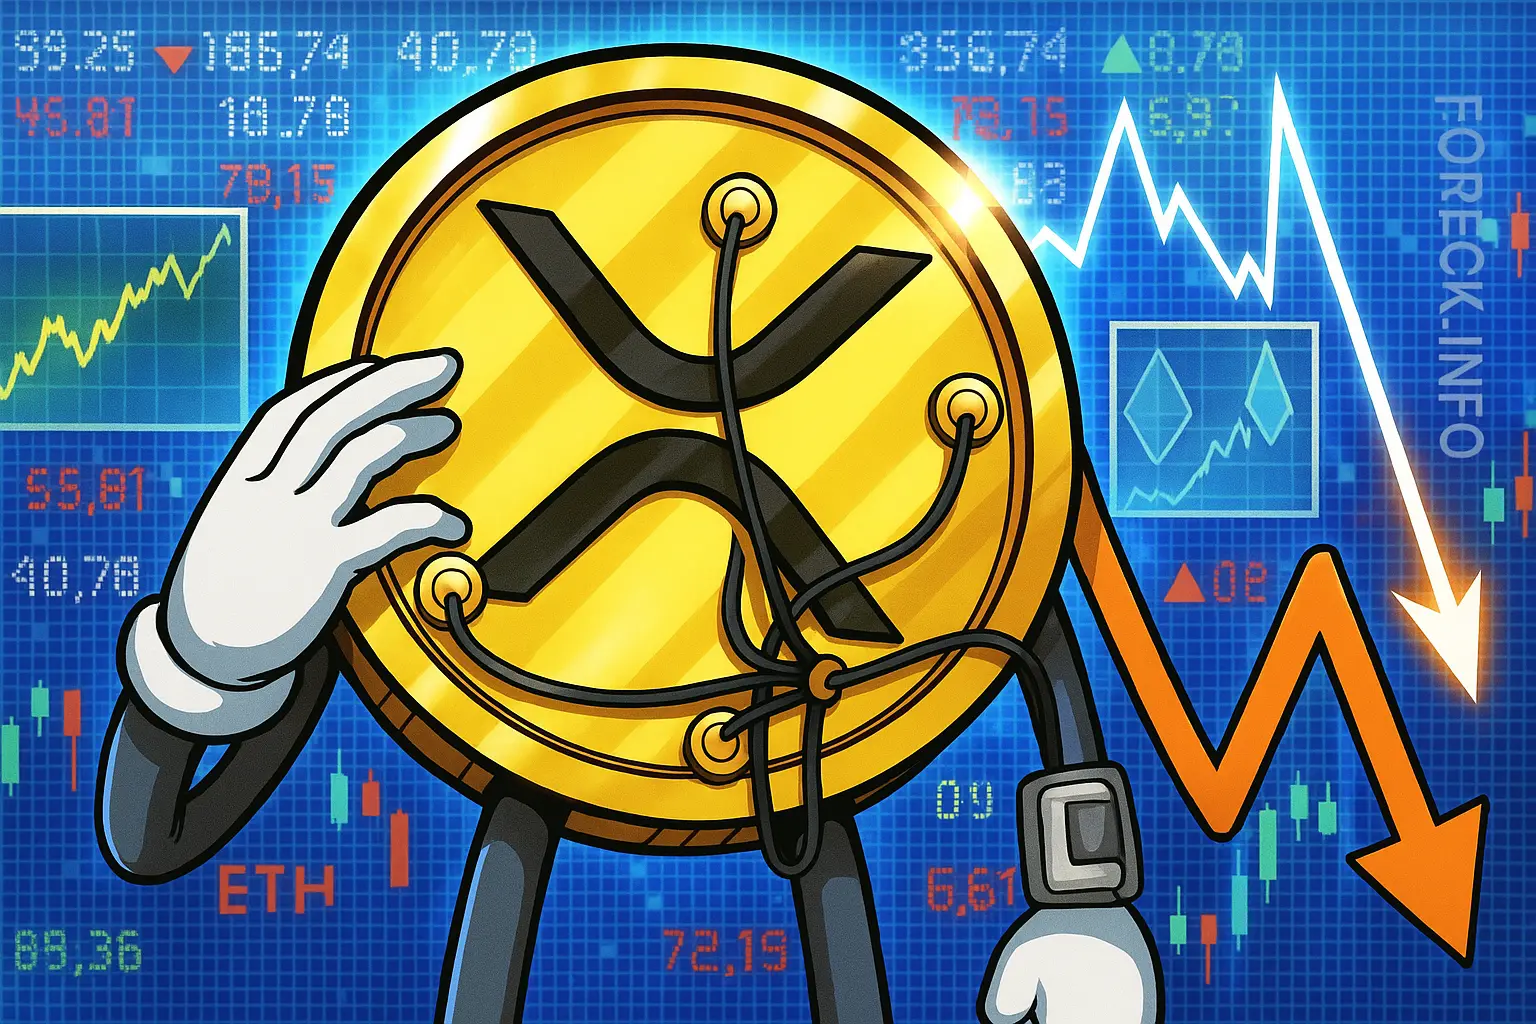
 XRP continues to display strong technical stability, even after a moderate pullback from recent highs. On the daily chart, price action has retraced to the upper boundary of a previously established support zone—seen as a healthy move within a broader bullish structure. Notably, XRP remains above its 50-day Exponential Moving Average (EMA), currently serving as dynamic support and sending a positive technical signal.
 By John Isige
 The crypto market just printed its first red candle in six weeks. After a sharp rally, traders are locking in profits, driving a wave of short-term pessimism and heightening liquidation risk across select altcoins. Early August brings heightened volatility, with several assets poised for large-scale derivatives liquidations.
 By John Isige
 Whales Drive Ethereum Demand as Retail Stays Defensive
 By John Isige
 Strategist Predicts Major Underperformance for Crypto Assets
 By John Isige
 Bitcoin’s July decline driven by record-low exchange liquidity, volatile ETF flows, and waning institutional demand. Analysis, key data, and expert perspectives investors.
 By John Isige
 The U.S. spot Ethereum ETF market has experienced its largest ever outflows, even as the overall crypto market stages a comeback. On August 4, net outflows from ETH ETFs reached a record $465.06 million, according to SoSoValue.
 By Sagar Dua
 ETH/USD has corrected from its yearly highs near $3,940 last week and remains unable to break above the $3,750 level (Murray [4/8], midline of the Bollinger Bands). The market remains under pressure following the latest Federal Reserve meeting, where the Fed left rates at 4.50% and signaled a longer pause on rate cuts due to persistent inflation concerns.


For crypto, the framework is similar to traditional financial markets but comes with its own twist. Here, price action turns on liquidity, adoption, regulation, and flows from institutions alongside retail sentiment. Network health—hash rate, staking, active wallets—adds another layer. Macro still matters too: rates, dollar strength, and risk appetite shape inflows and outflows. Then, as with any market, you use the chart—trend, support and resistance, momentum, and volume—to spot setups and manage risk.