

Technical indicators continue to point to a sell signal: Bollinger Bands are turning lower, the MACD histogram is expanding in negative territory, and the Stochastic oscillator has entered oversold territory, which does not rule out a limited corrective rebound.
It is also worth noting that on the weekly chart, Bollinger Bands are turning downward, while the price action has completed a “flag” pattern within a downtrend, increasing the likelihood of further negative dynamics in the medium term.
Support and resistance levels
Resistance levels: 3165.00, 3750.00, 4062.50.
Support levels: 2187.50, 1875.00, 1481.60.
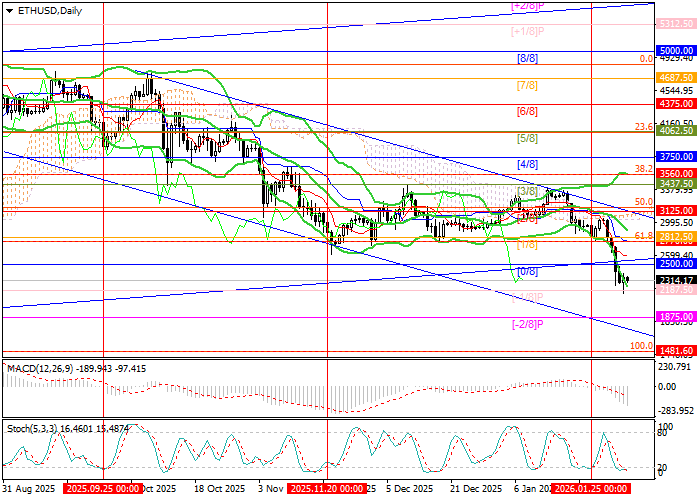
Trading scenarios and ETH/USD forecast
Short positions can be opened below the 2187.50 level with targets at 1875.00 and 1481.60, and a stop-loss at 2435.00. Time horizon: 5–7 days.
Long positions can be opened above the 3165.00 level with targets at 3750.00 and 4062.50, and a stop-loss at 2800.00.
Scenario
| Timeframe | Weekly |
| Recommendation | SELL STOP |
| Entry point | 2187.45 |
| Take Profit | 1875.00, 1481.60 |
| Stop Loss | 2435.00 |
| Key levels | 1481.60, 1875.00, 2187.50, 3165.00, 3750.00, 4062.50 |
Alternative scenario
| Recommendation | BUY STOP |
| Entry point | 3165.05 |
| Take Profit | 3750.00, 4062.50 |
| Stop Loss | 2800.00 |
| Key levels | 1481.60, 1875.00, 2187.50, 3165.00, 3750.00, 4062.50 |
