The SOL/USD pair had been trading within a prolonged downtrend, forming a corresponding descending channel. However, in mid-November, prices entered a sideways range of 150.00–125.00 (Murray level [6/8]), where they remain to this day. This week, the price reached the lower boundary of this range amid declining investor appetite for risk assets, triggered by statements from U.S. President Donald Trump regarding the possible annexation of Greenland. A breakdown below the 125.00 level could send the pair toward 107.40 (61.8% Fibonacci retracement, Murray level [1/8]) and 100.00 (Murray level [0/8]). Conversely, if the price consolidates above the middle Bollinger Band at 137.50 (Murray level [6/8]), upward momentum may resume toward the upper boundary of the sideways range at 150.00 and further to 162.50 (Murray level [+2/8], 38.2% Fibonacci retracement).
Technical indicators do not provide a clear signal: Bollinger Bands are flattening within the sideways range, the MACD histogram is preparing to enter negative territory, while the Stochastic Oscillator may turn upward from oversold levels. In addition, the weekly chart still reflects a medium-term downtrend, making further bearish movement the most likely scenario.
Support and Resistance Levels
Resistance levels: 137.50, 150.00, 162.50.
Support levels: 125.00, 107.40, 100.00. 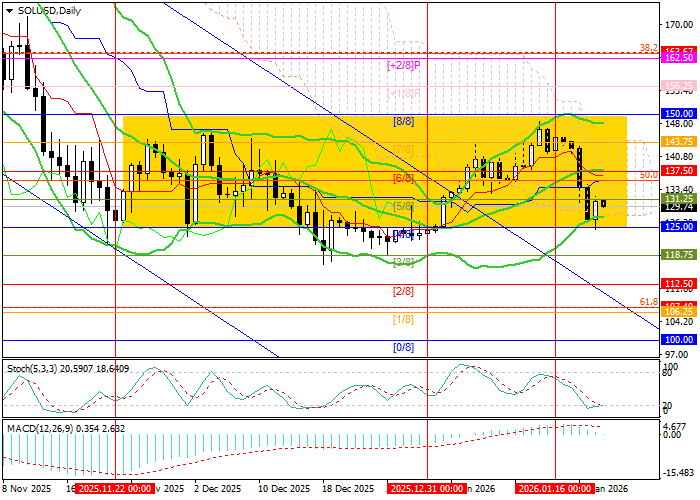
Trading Scenarios and SOL/USD Price Forecast
Short positions can be opened below the 125.00 level with targets at 107.40 and 100.00, and a stop-loss at 136.00. Time horizon: 5–7 days.
Long positions can be opened above the 137.50 level with targets at 150.00 and 162.50, and a stop-loss at 127.50.
Scenario
| Timeframe |
Weekly |
| Recommendation |
SELL STOP |
| Entry point |
124.10 |
| Take Profit |
107.40, 100.00 |
| Stop Loss |
136.00 |
| Key levels |
100.00, 107.40, 125.00, 137.50, 150.00, 162.50 |
Alternative Scenario
| Recommendation |
BUY STOP |
| Entry point |
138.50 |
| Take Profit |
150.00, 162.50 |
| Stop Loss |
127.50 |
| Key levels |
100.00, 107.40, 125.00, 137.50, 150.00, 162.50 |
SOL/USD remains under sustained bearish pressure, with price action confined to a narrow consolidation zone that increases the probability of a downside breakout. A confirmed move below 125 would likely accelerate selling toward 107 and 100, while bullish recovery requires a firm breakout above 137.5.
cryptocurrency journalist and market analyst who has accumulated great experience. He shares practicable insight with traders, investors, and enthusiasts of the crypto world. John loves to explore the dynamic Web3 space, which involves blockchain technology or different coins besides decentralized applications (dApps) leading decentralized finance (DeFi), smart contracts or interoperability among blockchains, non-fungible tokens (NFTs), real-world assets (RWAs), and artificial intelligence combining blockchain. John has worked for leading cryptocurrency resources, among them FORECK.INFO, CoinGape, CryptoNews, and Business2Community


