

Over the weekend, capital outflows from the cryptocurrency market totaled around $250 billion, pushing total market capitalization down to $2.7 trillion. According to CoinDesk, another wave of leveraged position liquidations amounting to $510.0 million occurred over the past 12 hours, with the bulk of losses concentrated in long positions ($391.6 million), reflecting a sharp decline in investor appetite for risk assets. The negative dynamics were driven by several factors, although experts disagree on which played the decisive role. Many point to rising geopolitical and trade tensions—namely the increased risk of a direct military confrontation between the US and Iran, as well as Washington’s introduction of a new round of import sanctions—which have destabilized the sector, prompting traders to increase gold purchases while the digital asset market suffers from a significant liquidity shortage. Additional pressure comes from monetary and political factors: last week, the US Federal Reserve kept its key interest rate unchanged at 3.75% amid slowing inflation, while Fed Chair Jerome Powell noted that borrowing costs could be adjusted in the future if inflation returns to the 2.0% target or if the labor market begins to weaken. Investors interpreted these comments as a signal that the current monetary stance will likely be maintained in the medium term, strengthening the US dollar against alternative assets. In addition, US President Donald Trump announced a likely successor to Powell once his term expires in May. Contrary to the expectations of most experts, the choice fell not on Kevin Hassett—an outspoken supporter of a weaker dollar—but on former Fed Governor Kevin Warsh, who is viewed as a more conservative policymaker favoring monetary discipline and a more hawkish stance. Nevertheless, analysts doubt that monetary easing will come to an abrupt halt, as the White House leader is likely to favor an official aligned with his broader interests. Finally, another factor behind the rise in risk aversion is the partial shutdown of the US government, which began today.
Overall sentiment in the sector remains negative, as evidenced by substantial outflows from exchange-traded funds totaling around $2.8 billion over the past two weeks, as well as the Fear & Greed Index remaining in the “extreme fear” zone at a reading of 14.
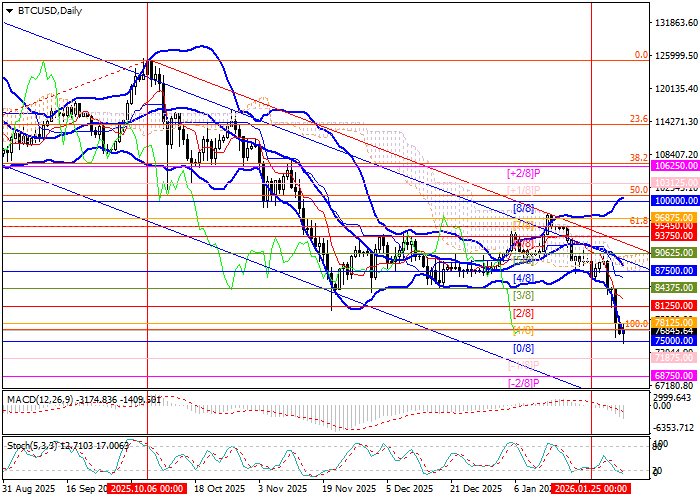
Support and Resistance Levels
The instrument has returned to the boundaries of a medium-term descending channel and is testing the 75,000.00 level (Murray [0/8]). A consolidation below this mark could trigger a further decline toward the 68,750.00 target (Murray [–2/8]). Conversely, a breakout above the middle line of the Bollinger Bands at 87,500.00 (Murray [4/8]) would likely open the way for upward movement toward 100,000.00 (Murray [8/8]) and 106,250.00 (Murray [+2/8], Fibonacci retracement 38.2%).
Technical indicators continue to signal selling pressure: Bollinger Bands are turning downward, the MACD histogram has moved into negative territory, and the Stochastic oscillator has entered the oversold zone, which does not rule out a limited corrective rebound.
Resistance levels: 87,500.00, 100,000.00, 106,250.00.
Support levels: 75,000.00, 68,750.00.
Trading Scenarios and BTC/USD Forecast
Short positions can be opened below the 75,000.00 level with a target at 68,750.00 and a stop loss at 79,500.00. Time horizon: 5–7 days.
Long positions can be opened above 87,500.00 with targets at 100,000.00 and 106,250.00, and a stop loss at 82,000.00.
Scenario
| Timeframe | Weekly |
| Recommendation | SELL STOP |
| Entry Point | 74,950.00 |
| Take Profit | 68,750.00 |
| Stop Loss | 79,500.00 |
| Key Levels | 68,750.00, 75,000.00, 87,500.00, 100,000.00, 106,250.00 |
Alternative Scenario
| Recommendation | BUY STOP |
| Entry Point | 87,600.00 |
| Take Profit | 100,000.00, 106,250.00 |
| Stop Loss | 82,000.00 |
| Key Levels | 68,750.00, 75,000.00, 87,500.00, 100,000.00, 106,250.00 |
