

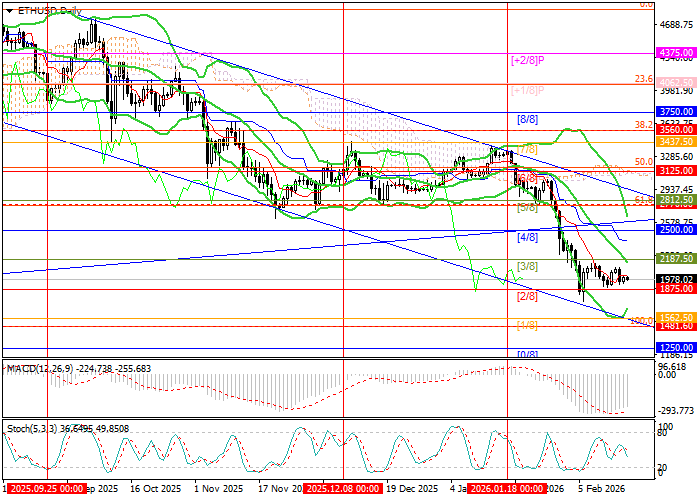
Over the past two weeks, the instrument has stabilized within a sideways range of 2187.50–1875.00 (Murray level [3/8]–[2/8]) and may well form a “flag” pattern again. A sustained move below this area (Murray level [2/8]) would open the way for further downside toward 1562.50 (Murray level [1/8]) and 1250.00 (Murray level [0/8]). The key level for bulls is seen at 2500.00 (Murray level [4/8]), reinforced by the upper Bollinger Band; a breakout above it would signal a trend reversal, with prices exiting the channel and testing 3125.00 (Murray level [6/8], 50.0% Fibonacci retracement) and 3750.00 (Murray level [8/8]).
Technical indicators point to strengthening bearish momentum: Bollinger Bands and the Stochastic oscillator are turning lower, while the MACD histogram remains stable in negative territory.
Support and Resistance Levels
Resistance levels: 2500.00, 3125.00, 3750.00.
Support levels: 1875.00, 1562.50, 1250.00.
Trading Scenarios and ETH/USD Forecast
Short positions may be opened below 1875.00, targeting 1562.50 and 1250.00, with a stop-loss at 2100.00. Time horizon: 5–7 days.
Long positions can be considered above 2500.00, with targets at 3125.00 and 3750.00, and a stop-loss at 2200.00.
Scenario
| Timeframe | Weekly |
| Recommendation | SELL STOP |
| Entry point | 1850.00 |
| Take Profit | 1562.50, 1250.00 |
| Stop Loss | 2100.00 |
| Key levels | 1250.00, 1562.50, 1875.00, 2500.00, 3125.00, 3750.00 |
Alternative Scenario
| Recommendation | BUY STOP |
| Entry point | 2550.00 |
| Take Profit | 3125.00, 3560.00 |
| Stop Loss | 2070.00 |
| Key levels | 1250.00, 1562.50, 1875.00, 2500.00, 3125.00, 3750.00 |
