

Investor attention was focused on January U.S. labor market and inflation data, which are key inputs for the Federal Reserve when determining the future course of monetary policy. The employment sector showed signs of stabilization, with the unemployment rate falling to 4.3% versus expectations of 4.4%, while nonfarm payrolls rose by 130.0K compared with preliminary estimates of 66.0K and 48.0K previously. Average hourly earnings increased by 0.4% versus 0.3% and 0.1%, respectively, raising the likelihood of accelerating consumer price growth. Taken together, this supports the Fed’s decision to keep interest rates elevated for a prolonged period and puts pressure on assets that compete with the U.S. dollar. On Friday, however, sentiment shifted sharply after the release of consumer price index data, which showed headline inflation easing from 2.7% to 2.4% year over year versus forecasts of 2.5%, while core inflation slowed from 2.6% to 2.5%. Inflation is now approaching the regulator’s target faster than previously expected, prompting analysts to factor in more than two policy adjustments this year, which briefly supported digital assets. Nevertheless, medium-term fundamentals remain negative for cryptocurrencies, as investors continue to be disappointed in them as safe-haven assets, traditionally favoring precious metals instead. In addition, the risk of a direct military confrontation between the U.S. and Iran—which could significantly destabilize the global economy through higher energy prices—remains in place.
Experts assess the potential of “digital gold” as weak, noting that it may be heading for its worst quarter in eight years. Since the beginning of the year, the coin has already lost more than 22.0% of its value, outflows from exchange-traded crypto products have reached $360.0 million, and the Fear & Greed Index remains in the “extreme fear” zone at a reading of 12.
Support and resistance levels
The instrument is moving within a medium-term downward trend, forming a corresponding channel around the 68,750.00 area (Murray level [3/8], 50.0% Fibonacci retracement). From this zone, a decline toward 56,250.00 (Murray level [1/8], 61.8% Fibonacci retracement) and 50,000.00 (Murray level [0/8]) is expected. However, if the price breaks above the middle line of the Bollinger Bands at 73,500.00, a resumption of growth toward 81,250.00 (Murray level [5/8], 38.2% Fibonacci retracement) and 93,750.00 (Murray level [7/8]) is possible.
Technical indicators maintain a sell signal: the MACD histogram remains stable in negative territory, Bollinger Bands are pointing downward, while the Stochastic oscillator is rising but approaching the overbought zone.
Resistance levels: 73,500.00, 81,250.00, 93,750.00.
Support levels: 68,750.00, 56,250.00, 50,000.00.
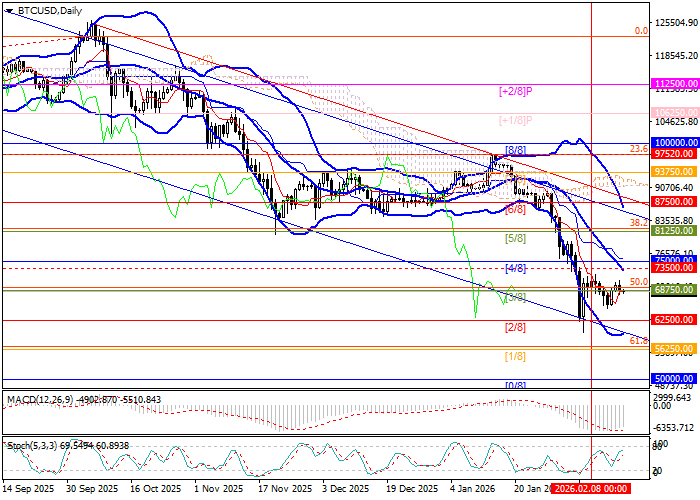
Trading scenarios and BTC/USD outlook
Short positions can be opened below 68,750.00 with targets at 56,250.00 and 50,000.00, and a stop-loss at 73,000.00. Time horizon: 5–7 days.
Long positions can be opened above 73,500.00 with targets at 81,250.00 and 93,750.00, and a stop-loss at 68,700.00.
Scenario
| Timeframe | Weekly |
| Recommendation | SELL STOP |
| Entry point | 67,500.00 |
| Take Profit | 56,250.00, 50,000.00 |
| Stop Loss | 73,000.00 |
| Key levels | 50,000.00, 56,250.00, 68,750.00, 73,500.00, 81,250.00, 93,750.00 |
Alternative scenario
| Recommendation | BUY STOP |
| Entry point | 74,000.00 |
| Take Profit | 81,250.00, 93,750.00 |
| Stop Loss | 68,700.00 |
| Key levels | 50,000.00, 56,250.00, 68,750.00, 73,500.00, 81,250.00, 93,750.00 |
